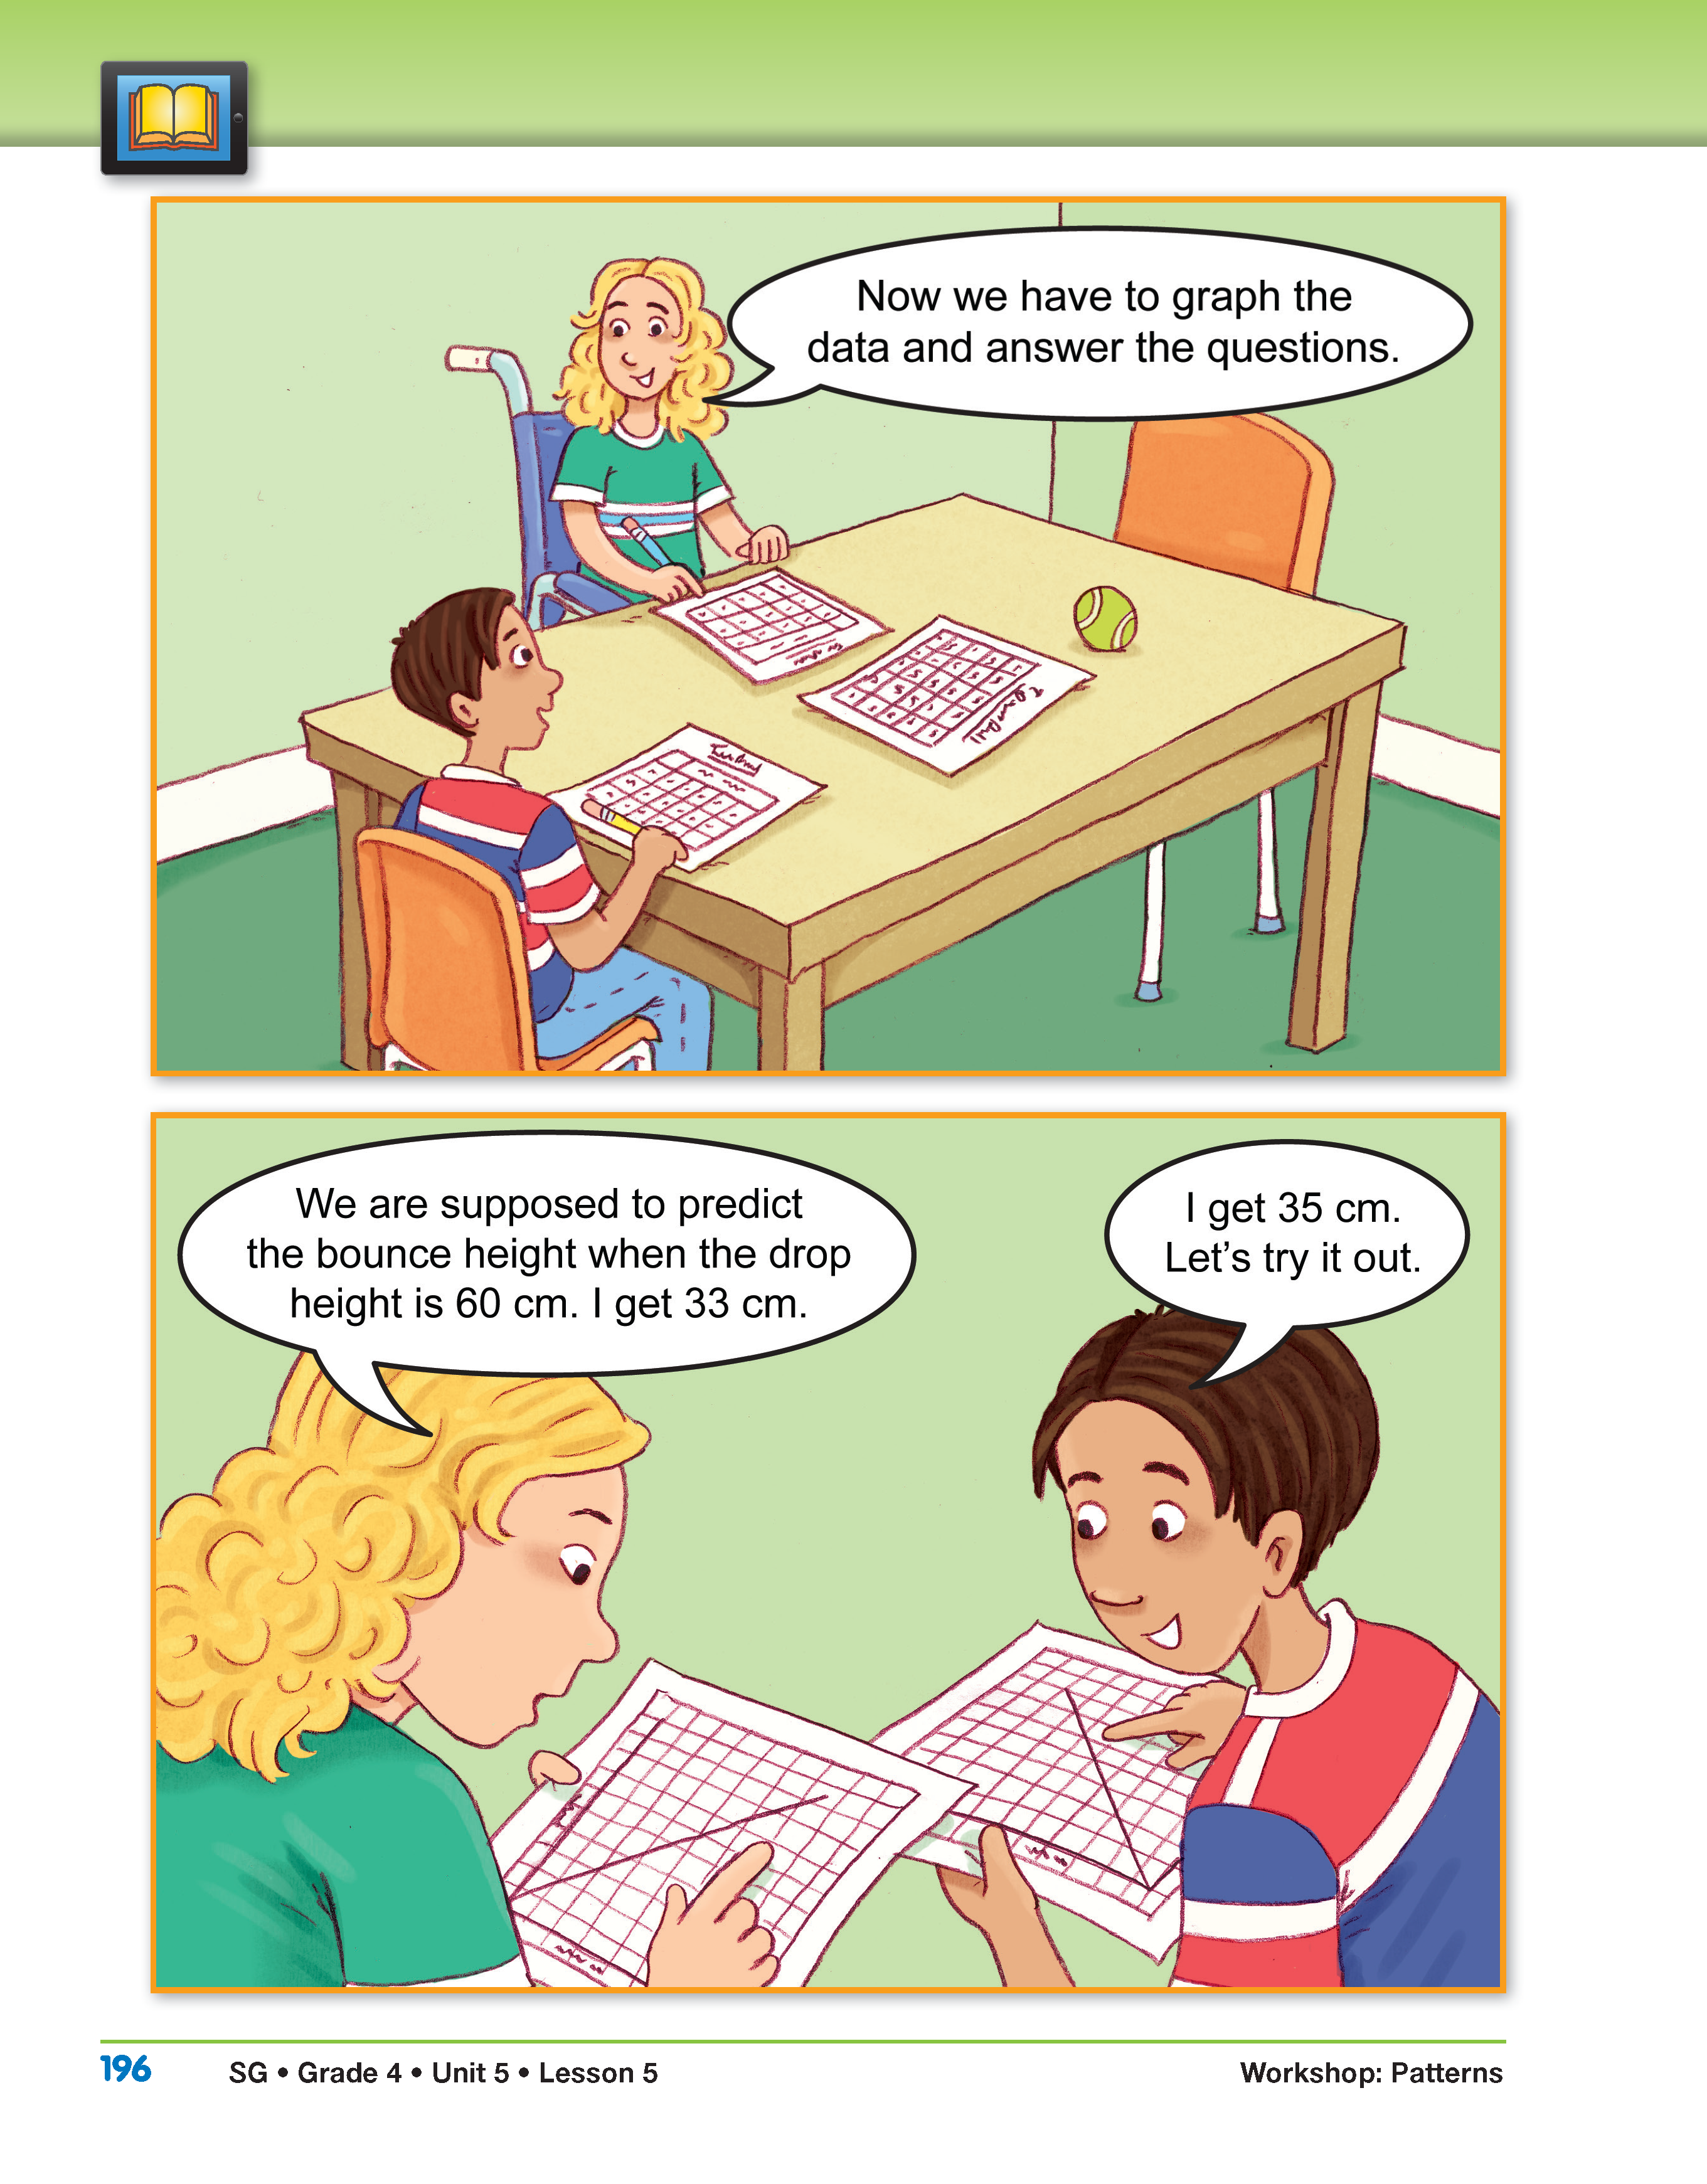
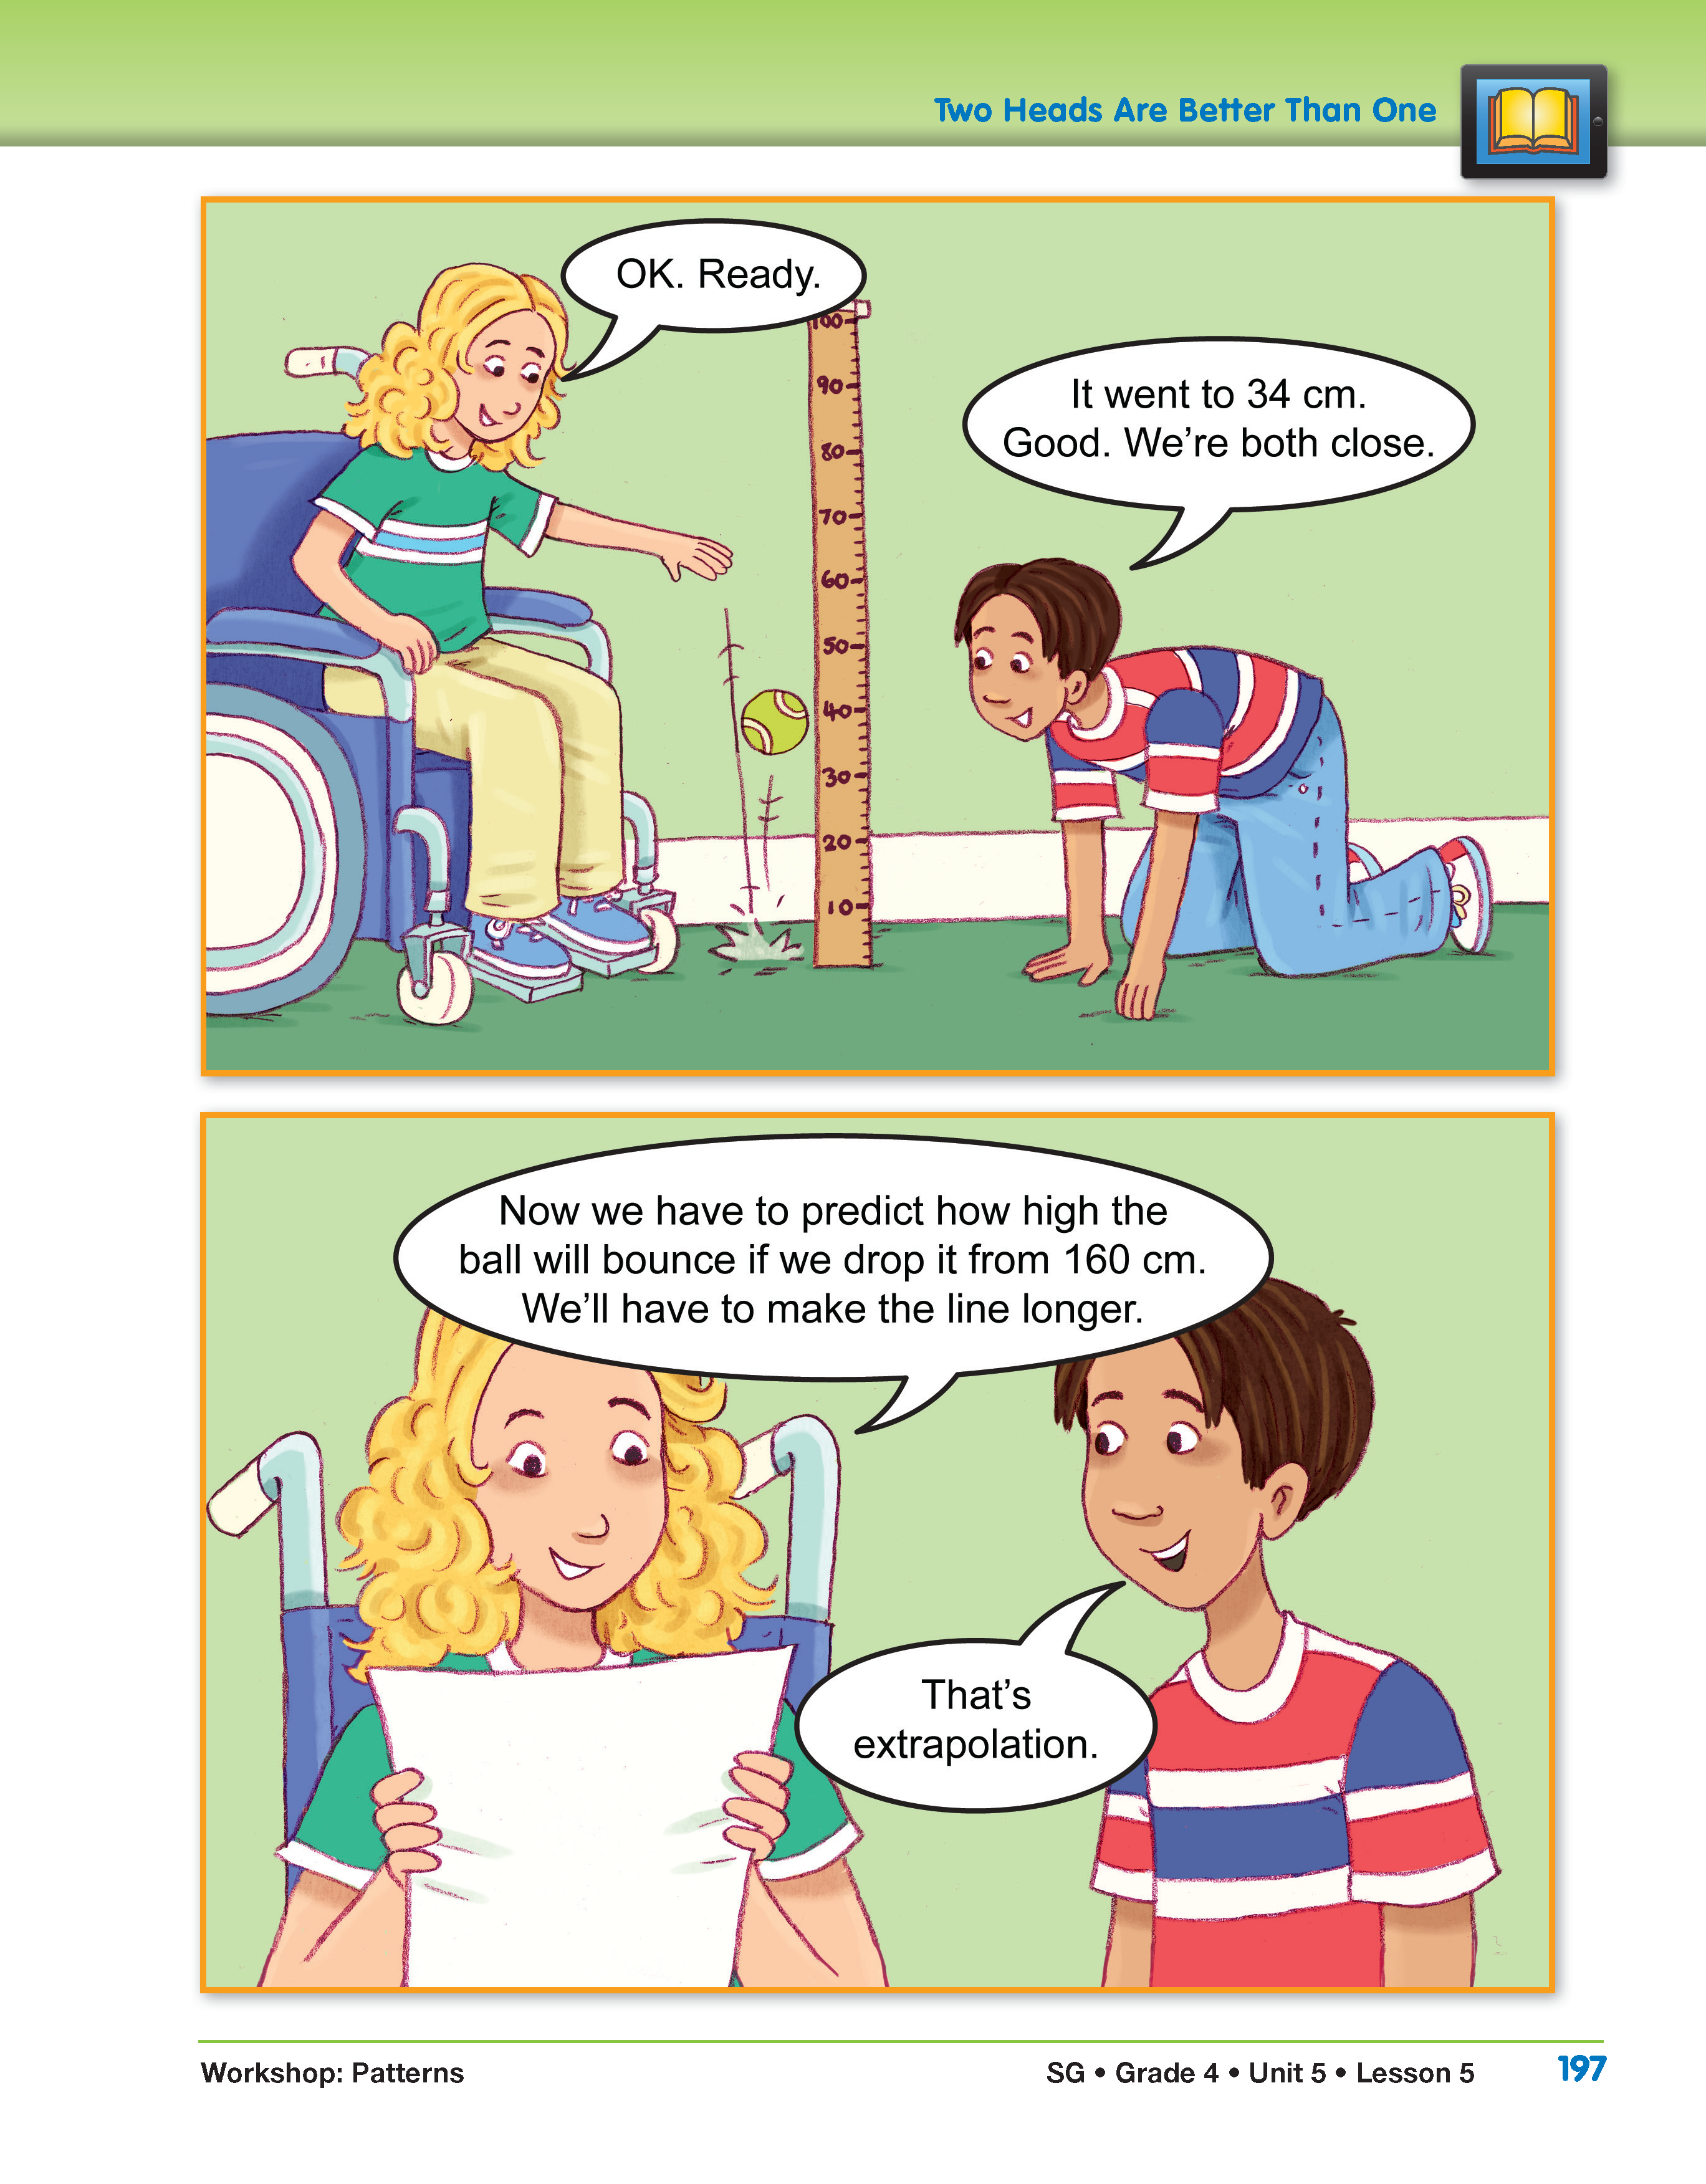
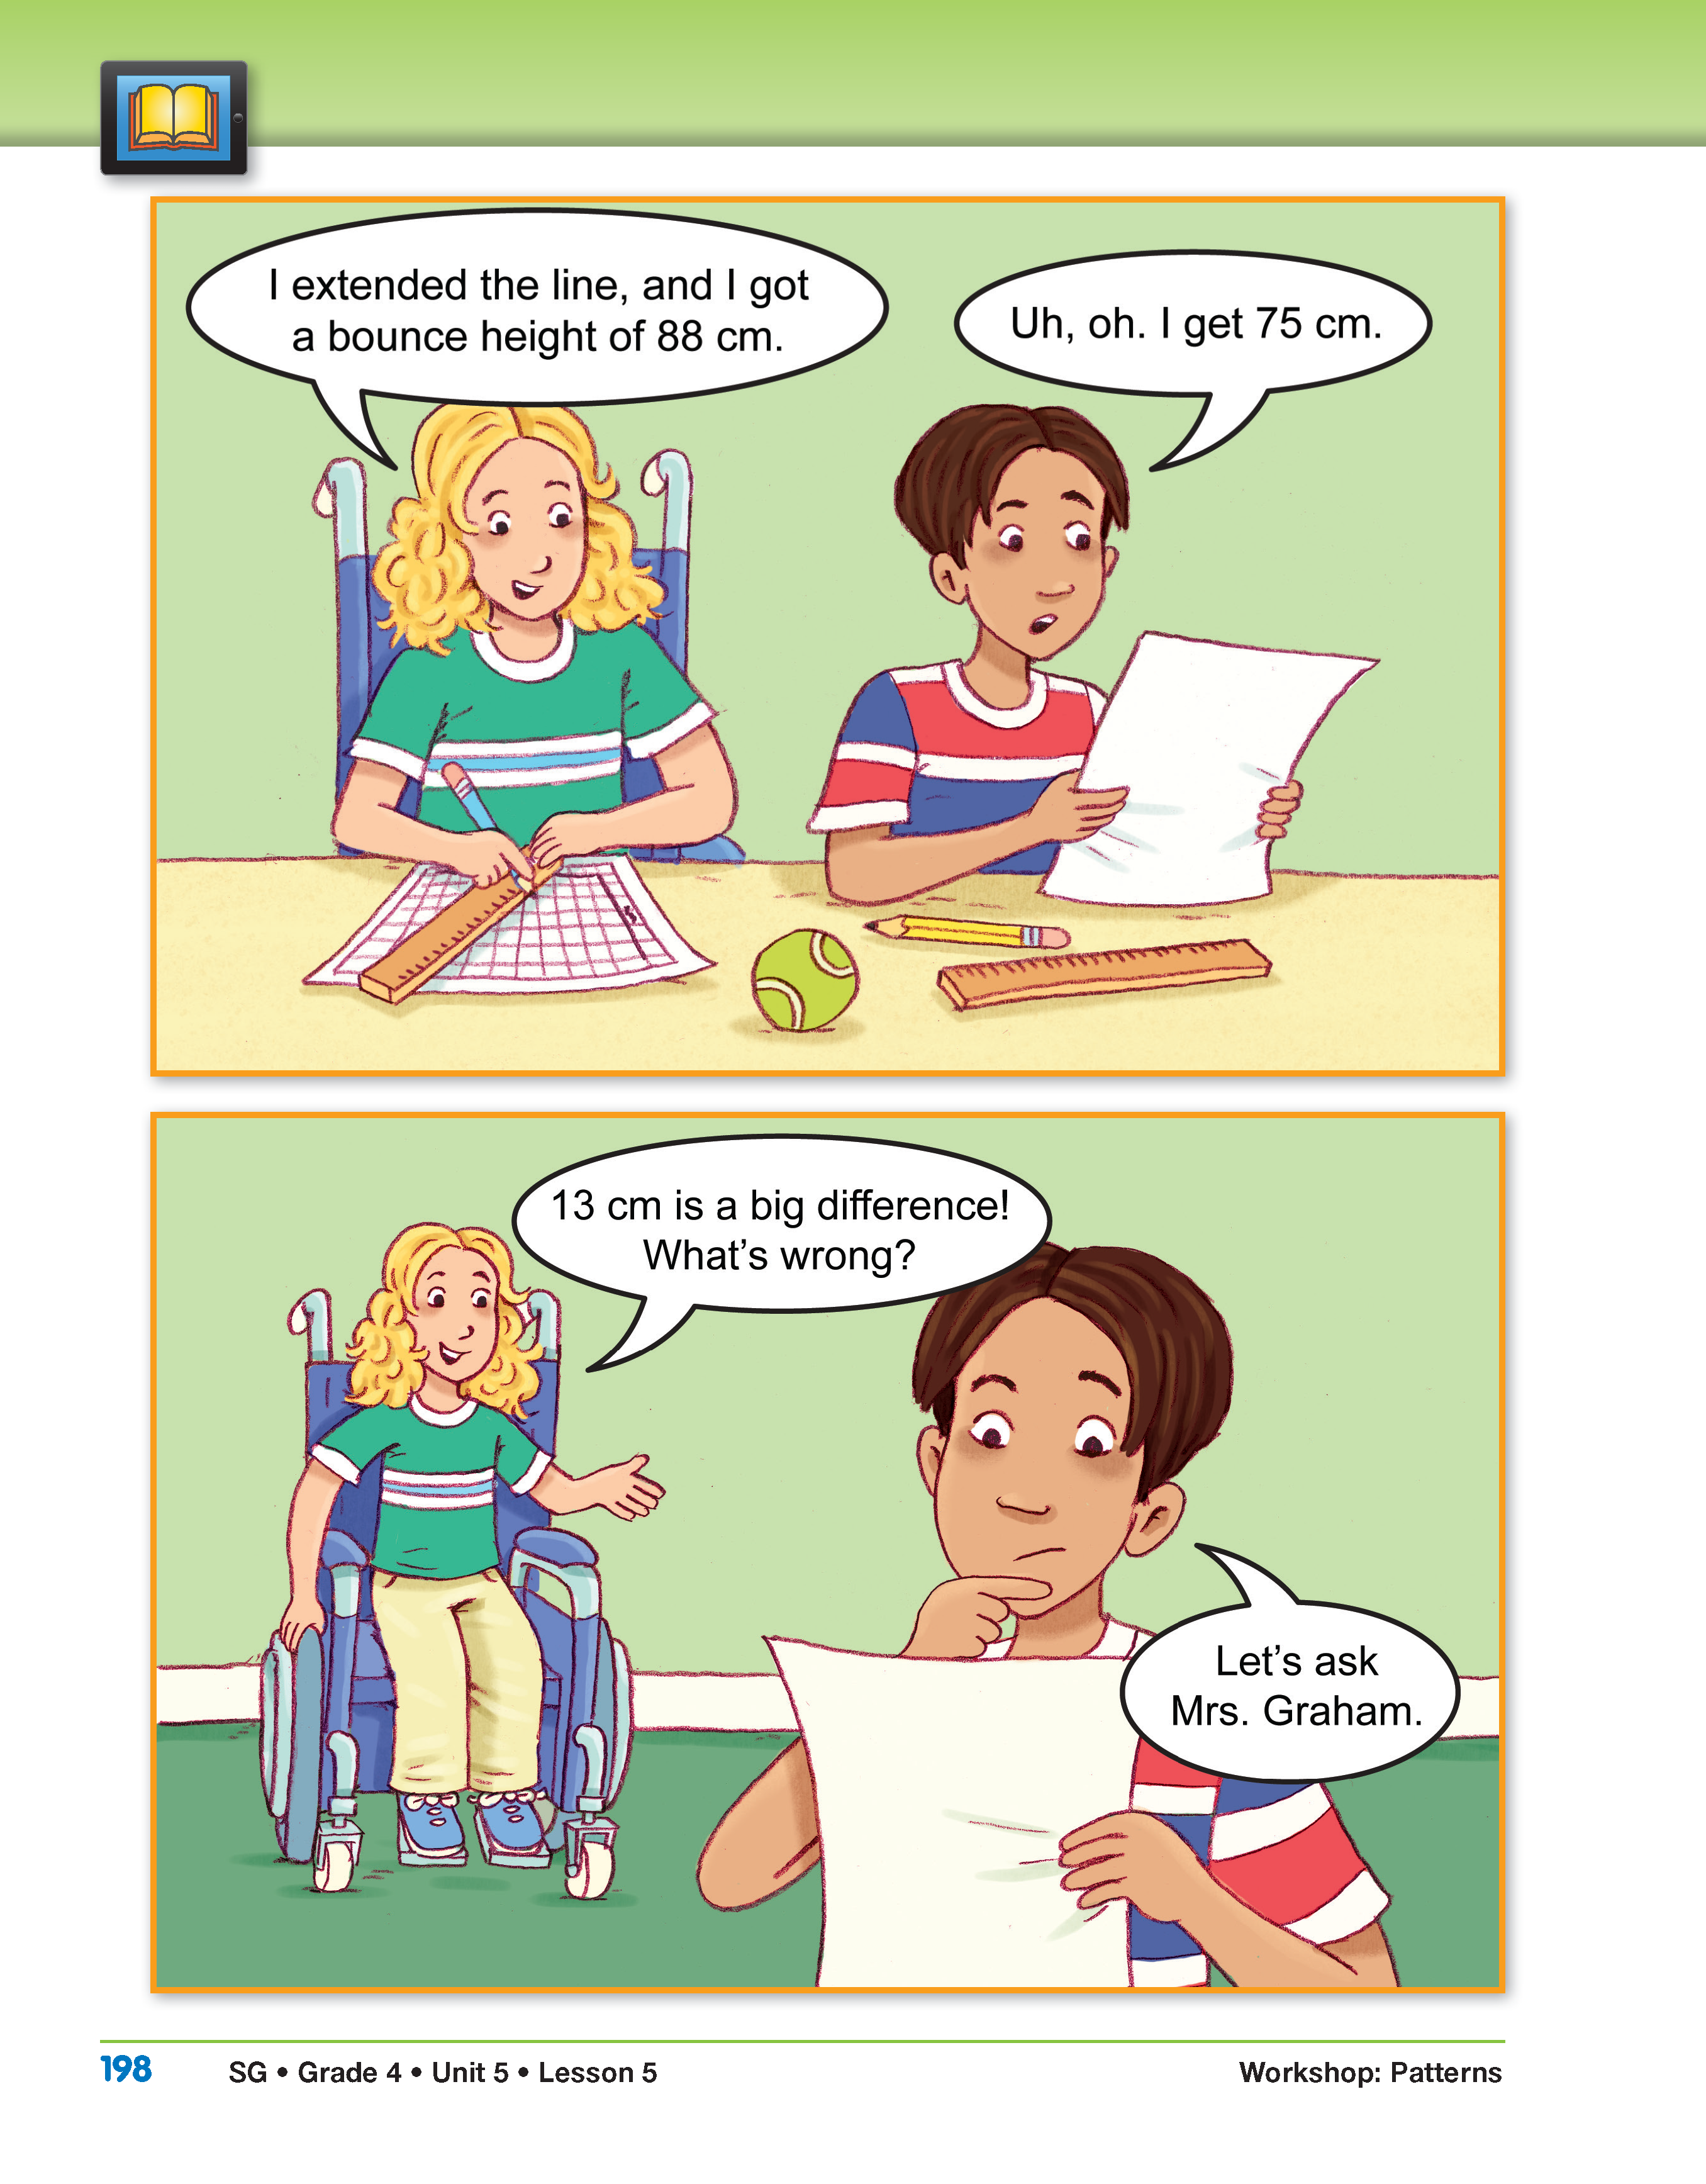
Prepare to Read the Story. Prepare students to read the story Two Heads Are Better Than One by discussing the patterns and representations seen thus far in this unit, specifically those in Lesson 1 and Bouncing Ball in Lesson 4.
- Think about the point graphs you used to solve problems in Lesson 1. How did the best-fit line help you to make reasonable predictions? (The best-fit line shows the trend that the data follows. You can use the line to make predictions because you know that all of the data points will most likely be close to the best-fit line.)
- How did the patterns in your data tables help you make predictions in the Bouncing Ball investigation? (We looked for patterns between the drop height and the bounce height. With the tennis ball the bounce height was always about half of the drop height, but with the SuperBall® the bounce height was always about three-fourths of the drop height. We could use this pattern to make predications for the drop height if we knew the bounce height.)
Read the Story. Tell students that they are going to read a story about two students who are working on a bouncing ball investigation. Direct them to the story Two Heads Are Better Than One in the Student Guide. Read and discuss the story together as a class using the discussion prompts that follow.
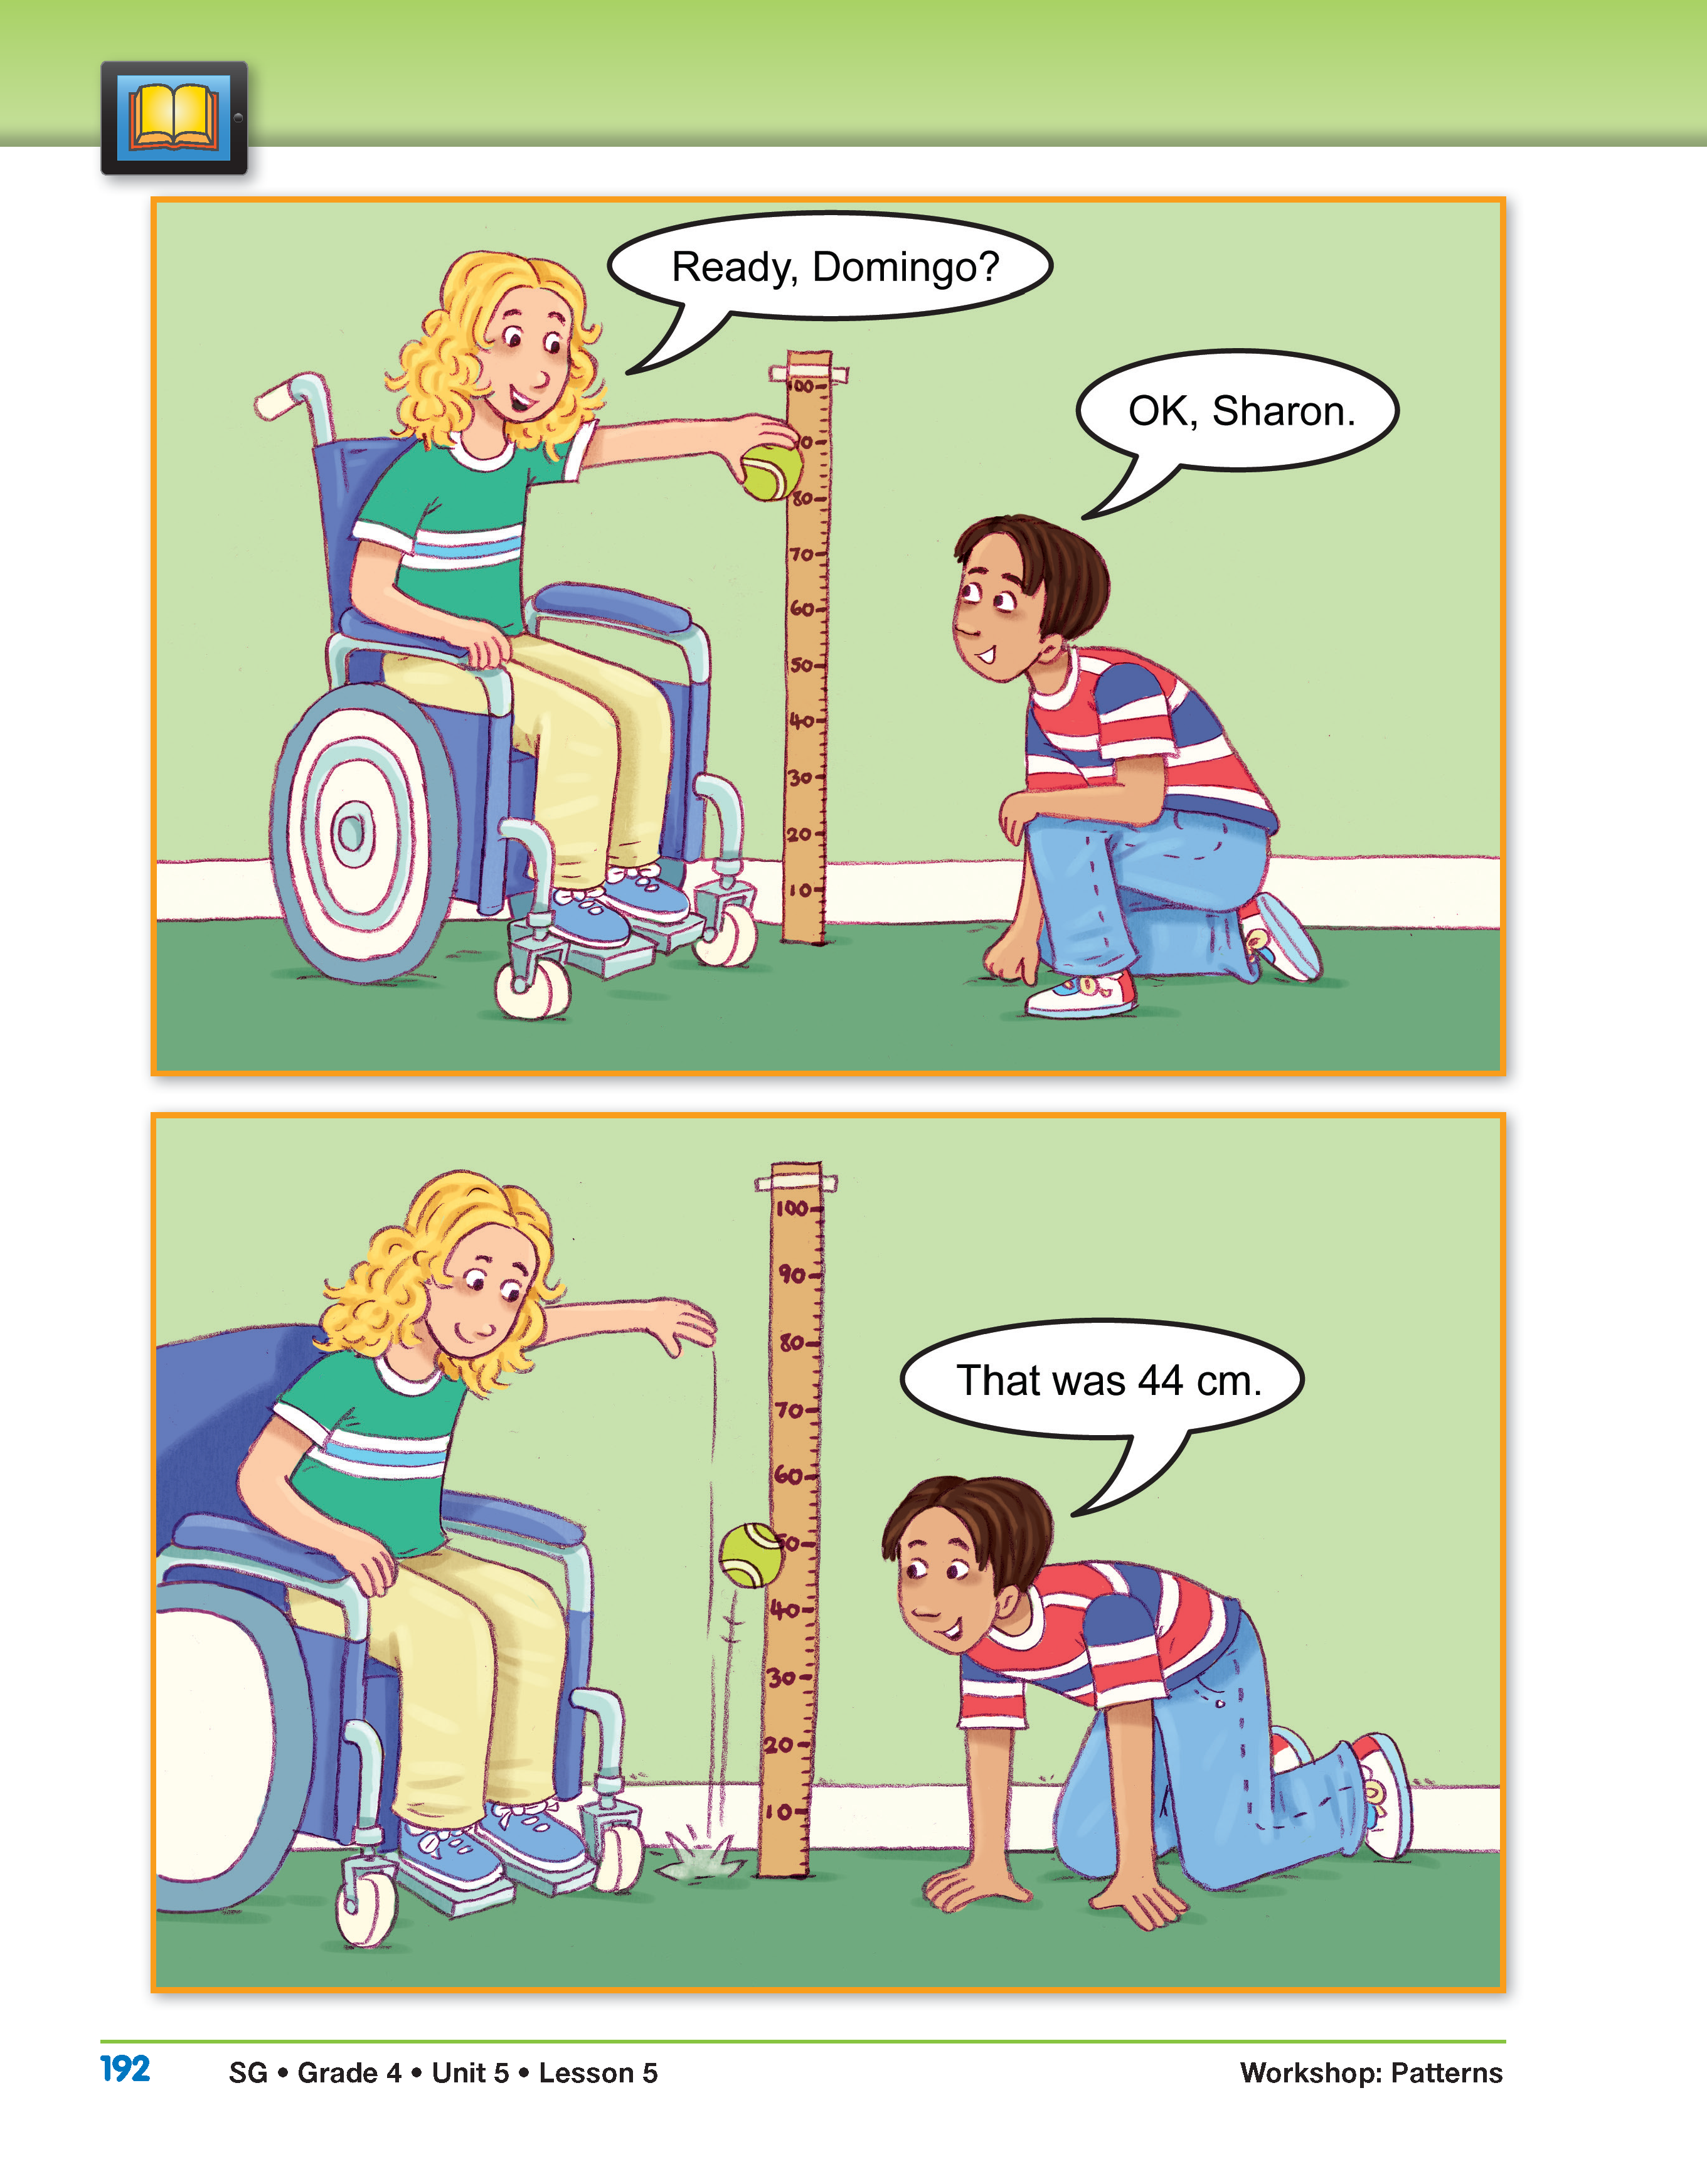
Page 192
- What experiment do you think Sharon and Domingo are working on? (They are doing the Bouncing Ball lab.)
- What is the drop height of the ball? (80 cm)
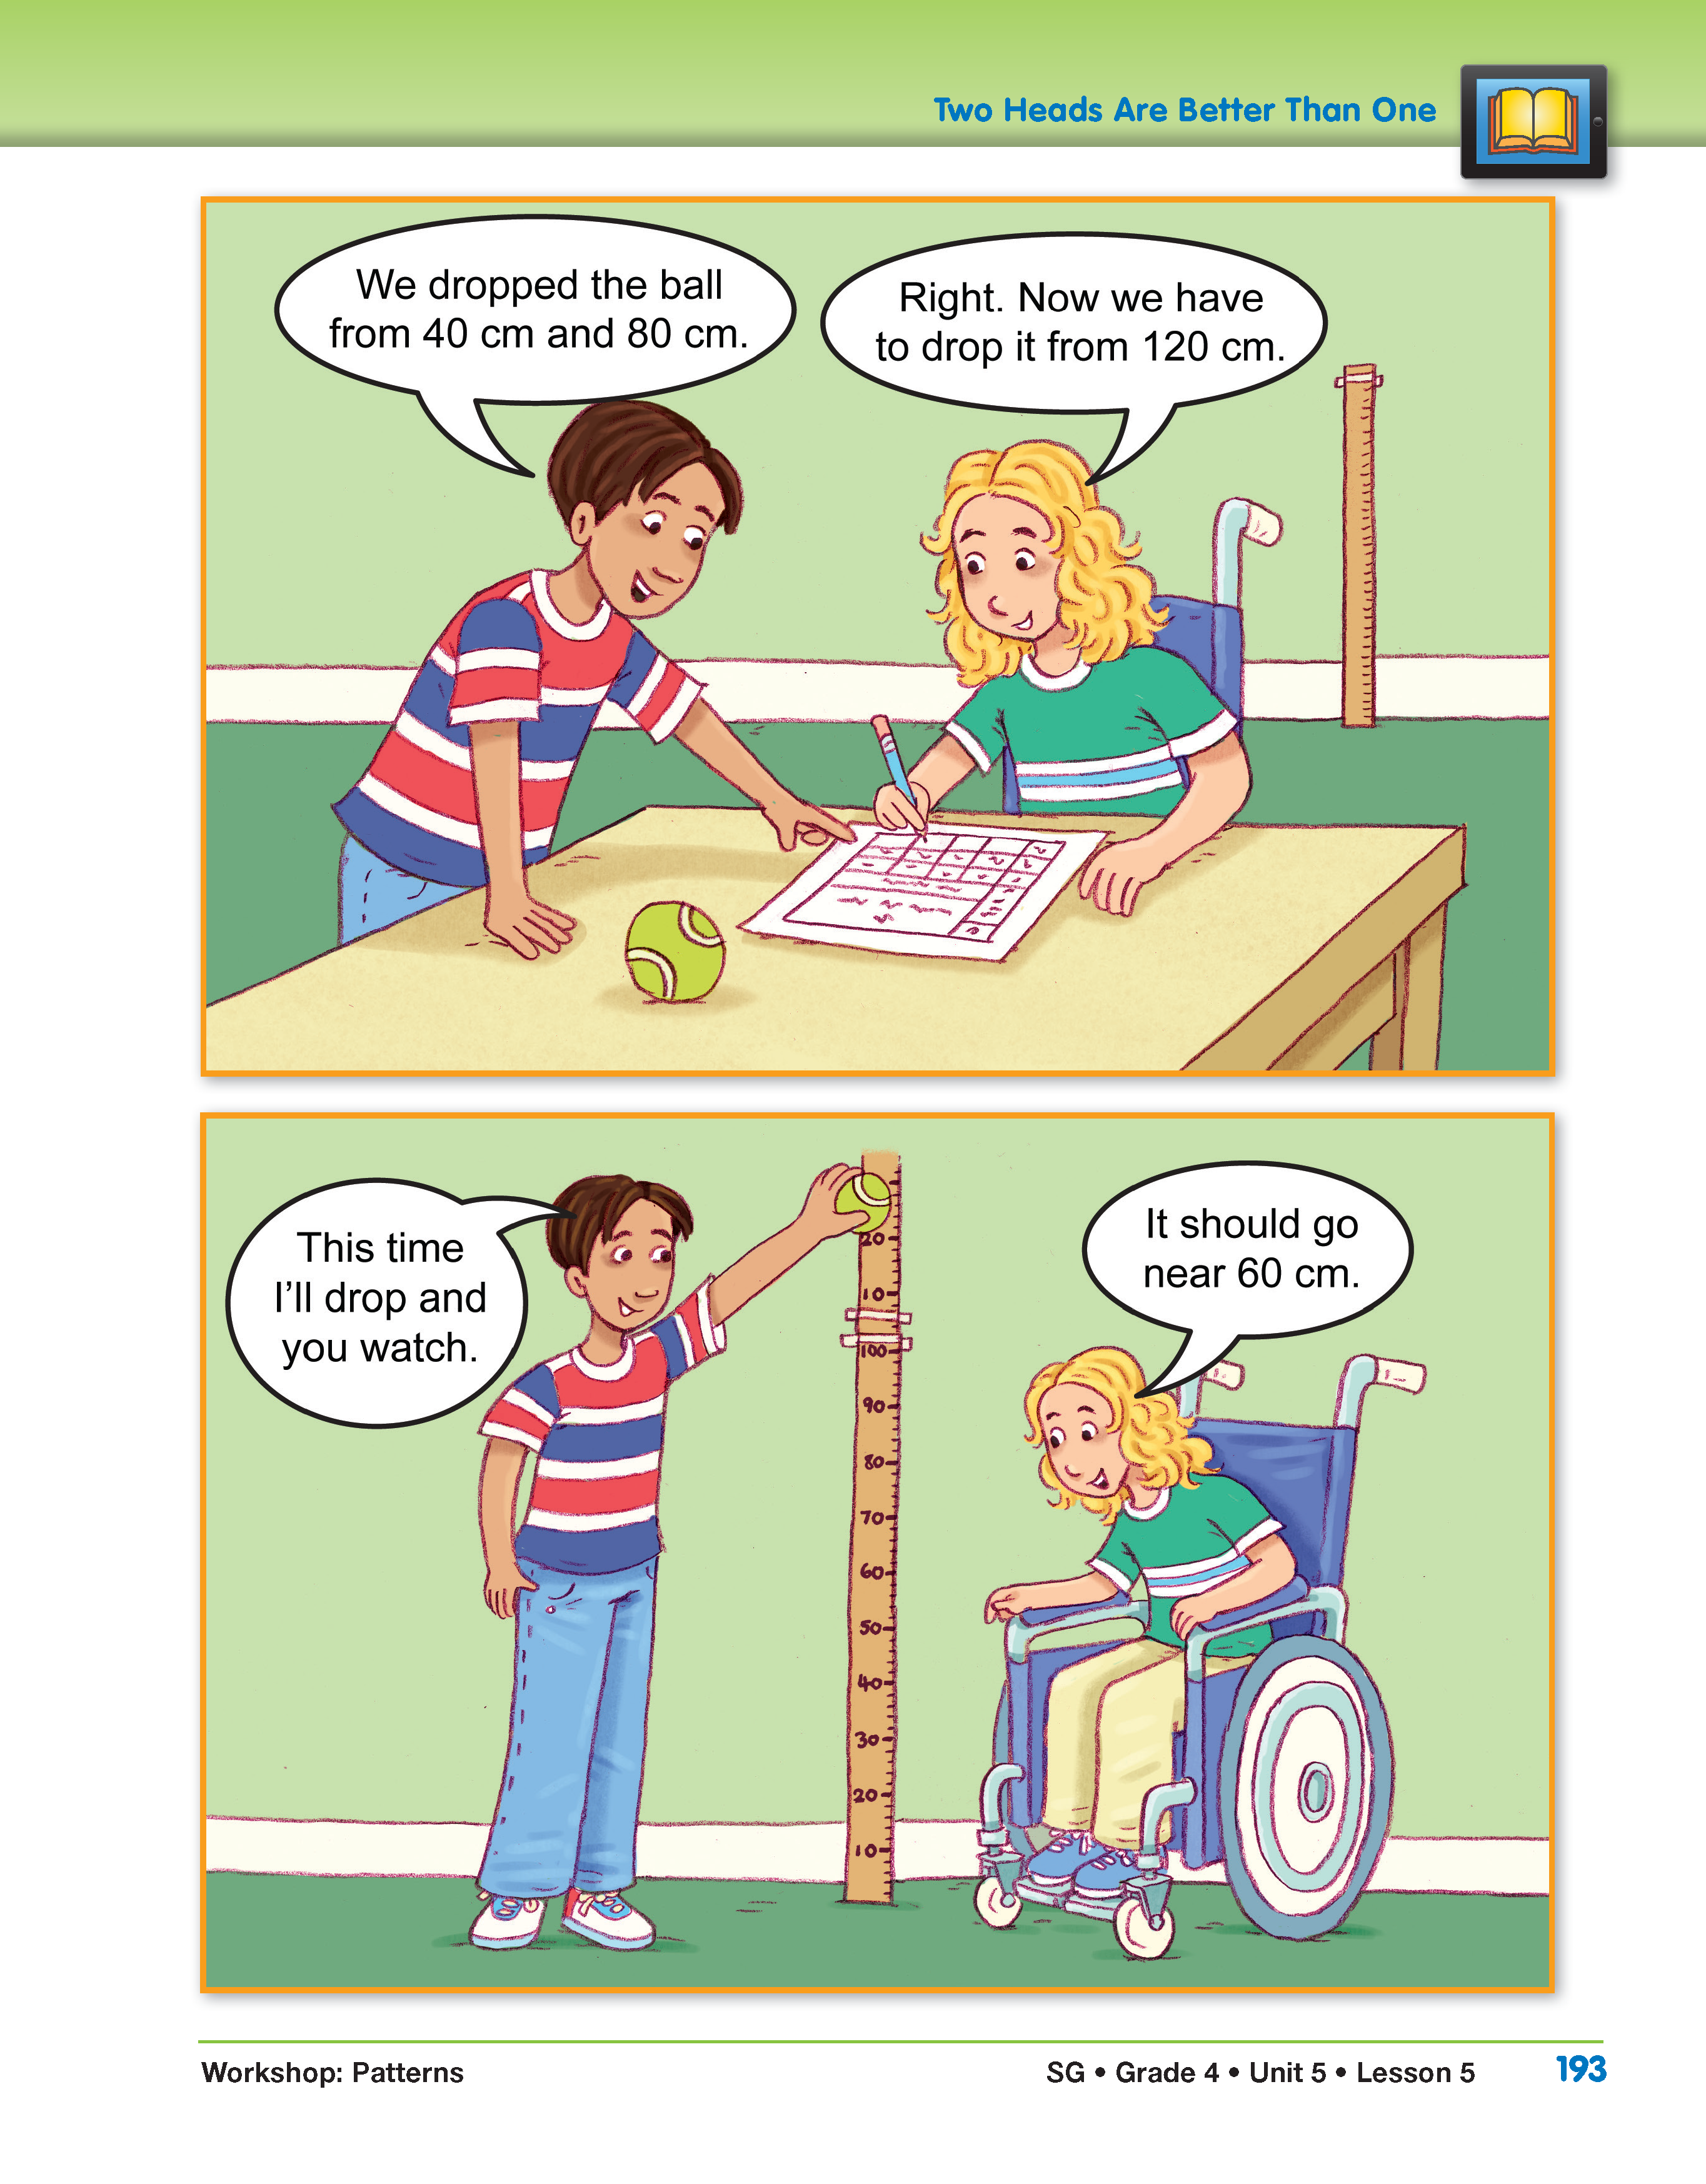
Page 193
- Why does Sharon predict that the ball will bounce 60 cm when Domingo drops it from 120 cm? (When Sharon dropped the ball from 80 cm it bounced back 44 cm or about half as high.)
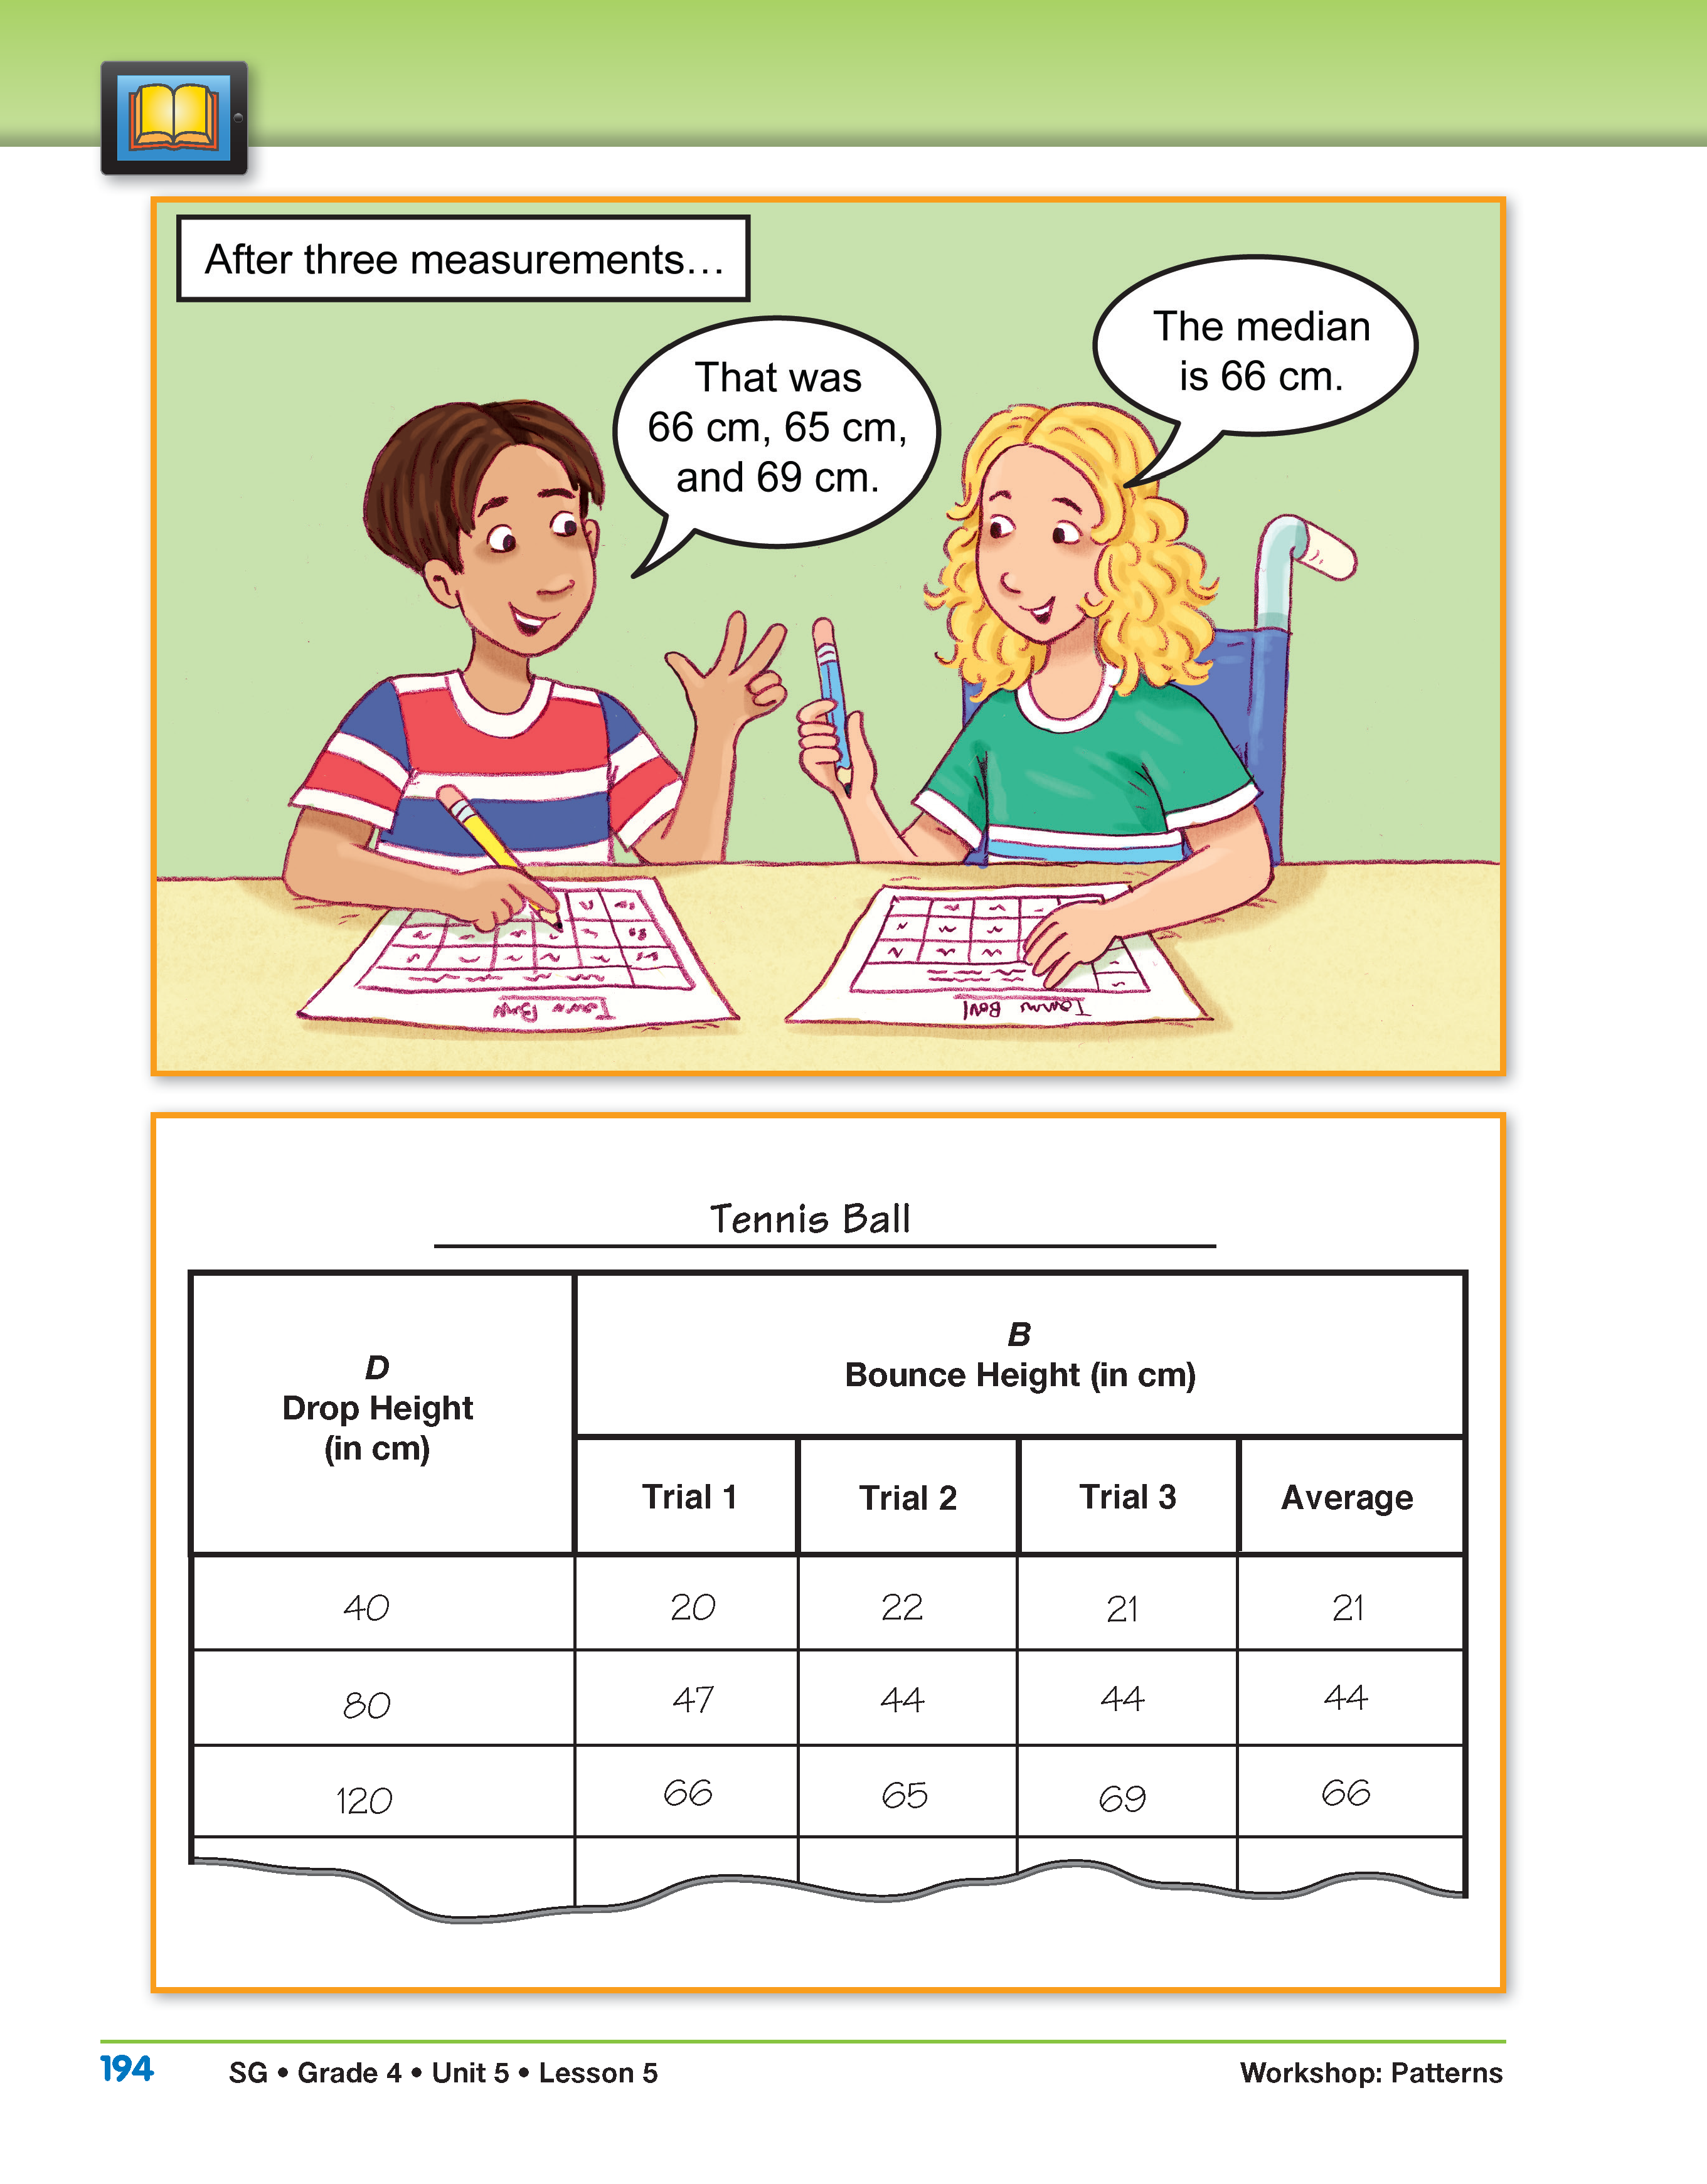
Page 194
- Look at the data table Sharon and Domingo made. Does it look similar to your data table for the tennis ball experiment? Why or why not? (This data table is similar because Sharon and Domingo dropped the ball three times for each drop height and then found the average bounce height. That is the same thing we did in our experiment.)
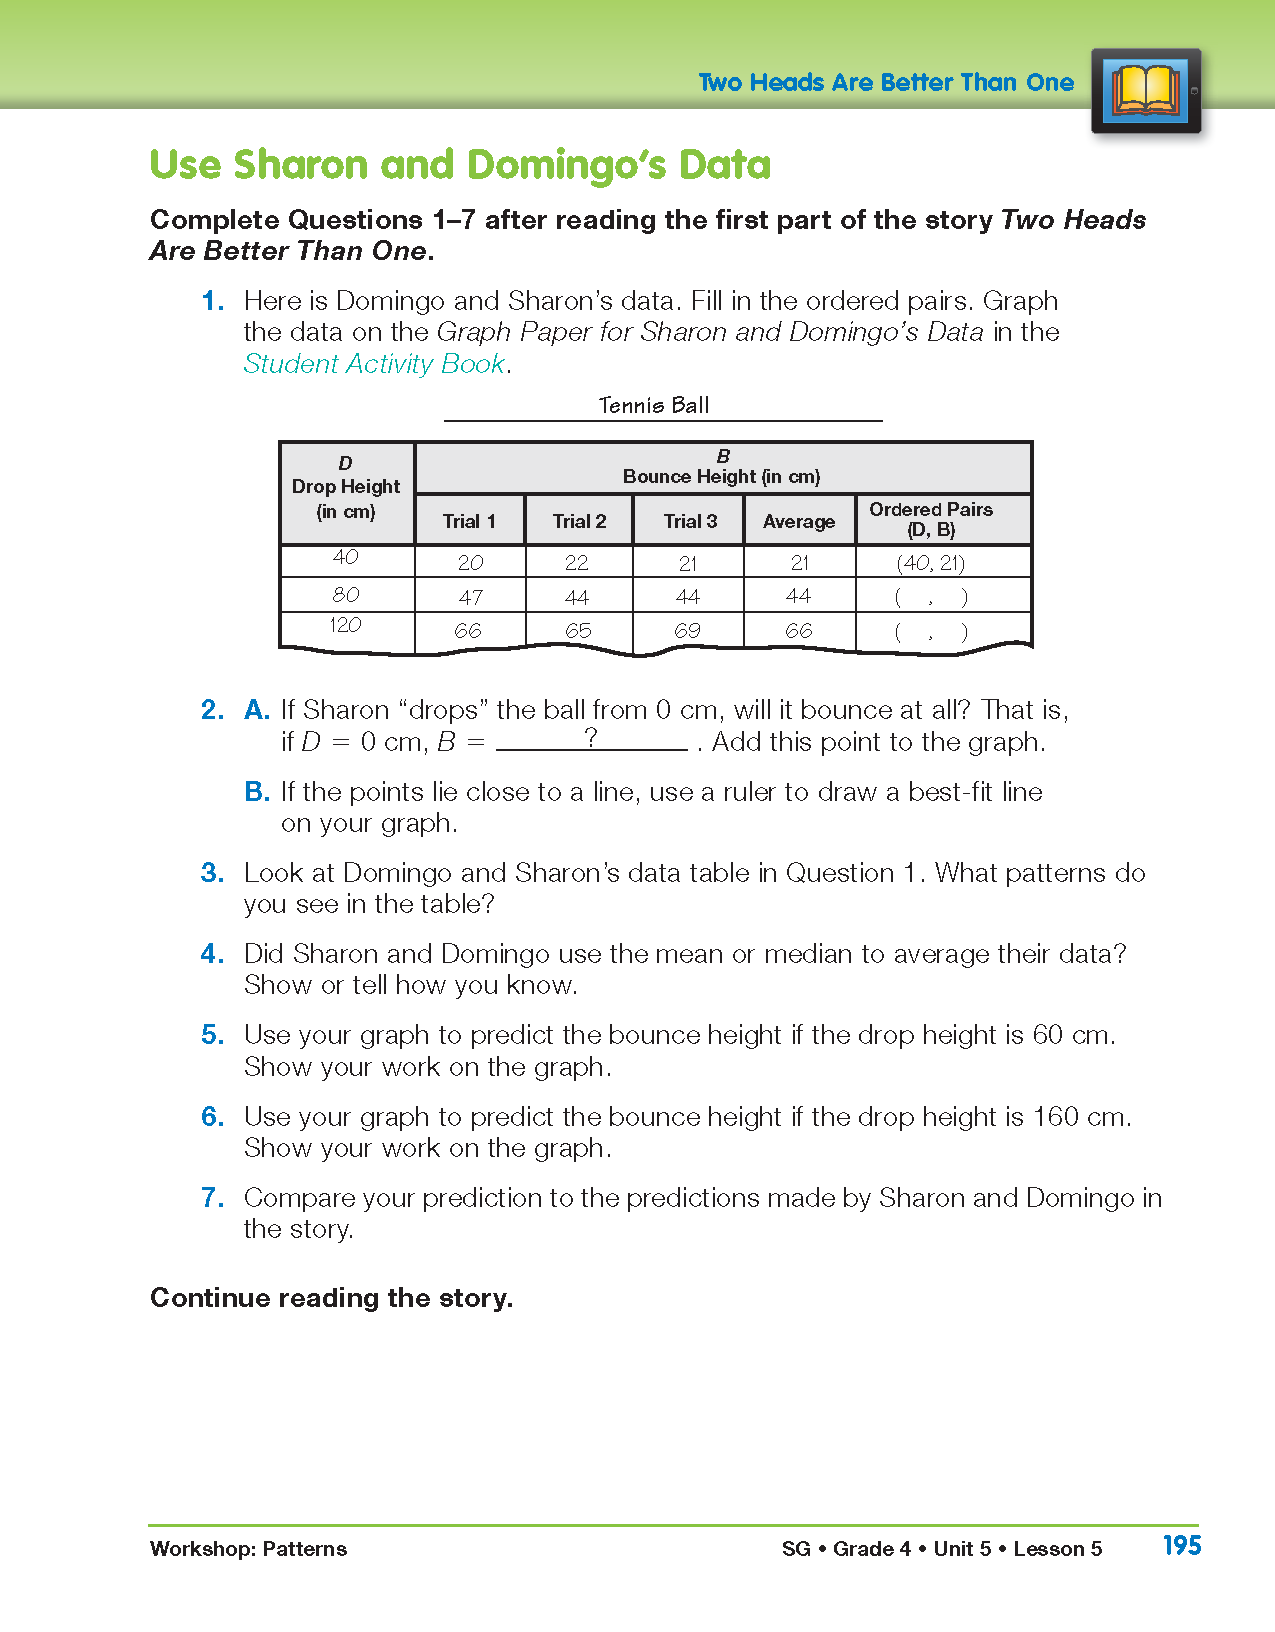
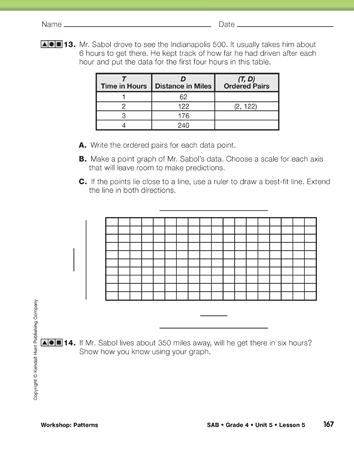
Use Sharon and Domingo's Data. After reading the first part of the story, direct students to the Use Sharon and Domingo's Data section in the Student Guide. Working with a partner, ask students to complete Questions 1–7. Students will need the Graph Paper for Sharon and Domingo's Data pages in the Student Activity Book to answer Question 1.
Observe students while they are working on Questions 1–7 in the Student Guide. Use this opportunity to assess students' abilities to make a point graph and draw a best-fit line [E3, E4] and to use a graph and table to make generalizations and predictions [E7].
Continue to read the story after students have had sufficient time to complete Questions 1–7. Use the story and the following discussion prompts to check and discuss their responses to Questions 1–7.
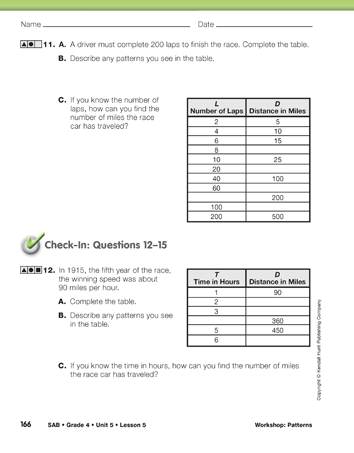
- As you looked at the data table what patterns did you see? (The bounce height was about half of the drop height, or the drop height was about twice as high as the bounce height.)
- Think about the pattern you found. If you know that the drop height was 100 cm, what would be a reasonable prediction for the bounce height? (50 cm) Explain how you know. (I know from the data table that the drop height is twice as high as the bounce height. Since 50 is half of 100, the bounce height would have to be about 50.)
- Using this pattern, how could you find the drop height if you know the bounce height? (You can just multiply the bounce height by 2 to get the drop height.)
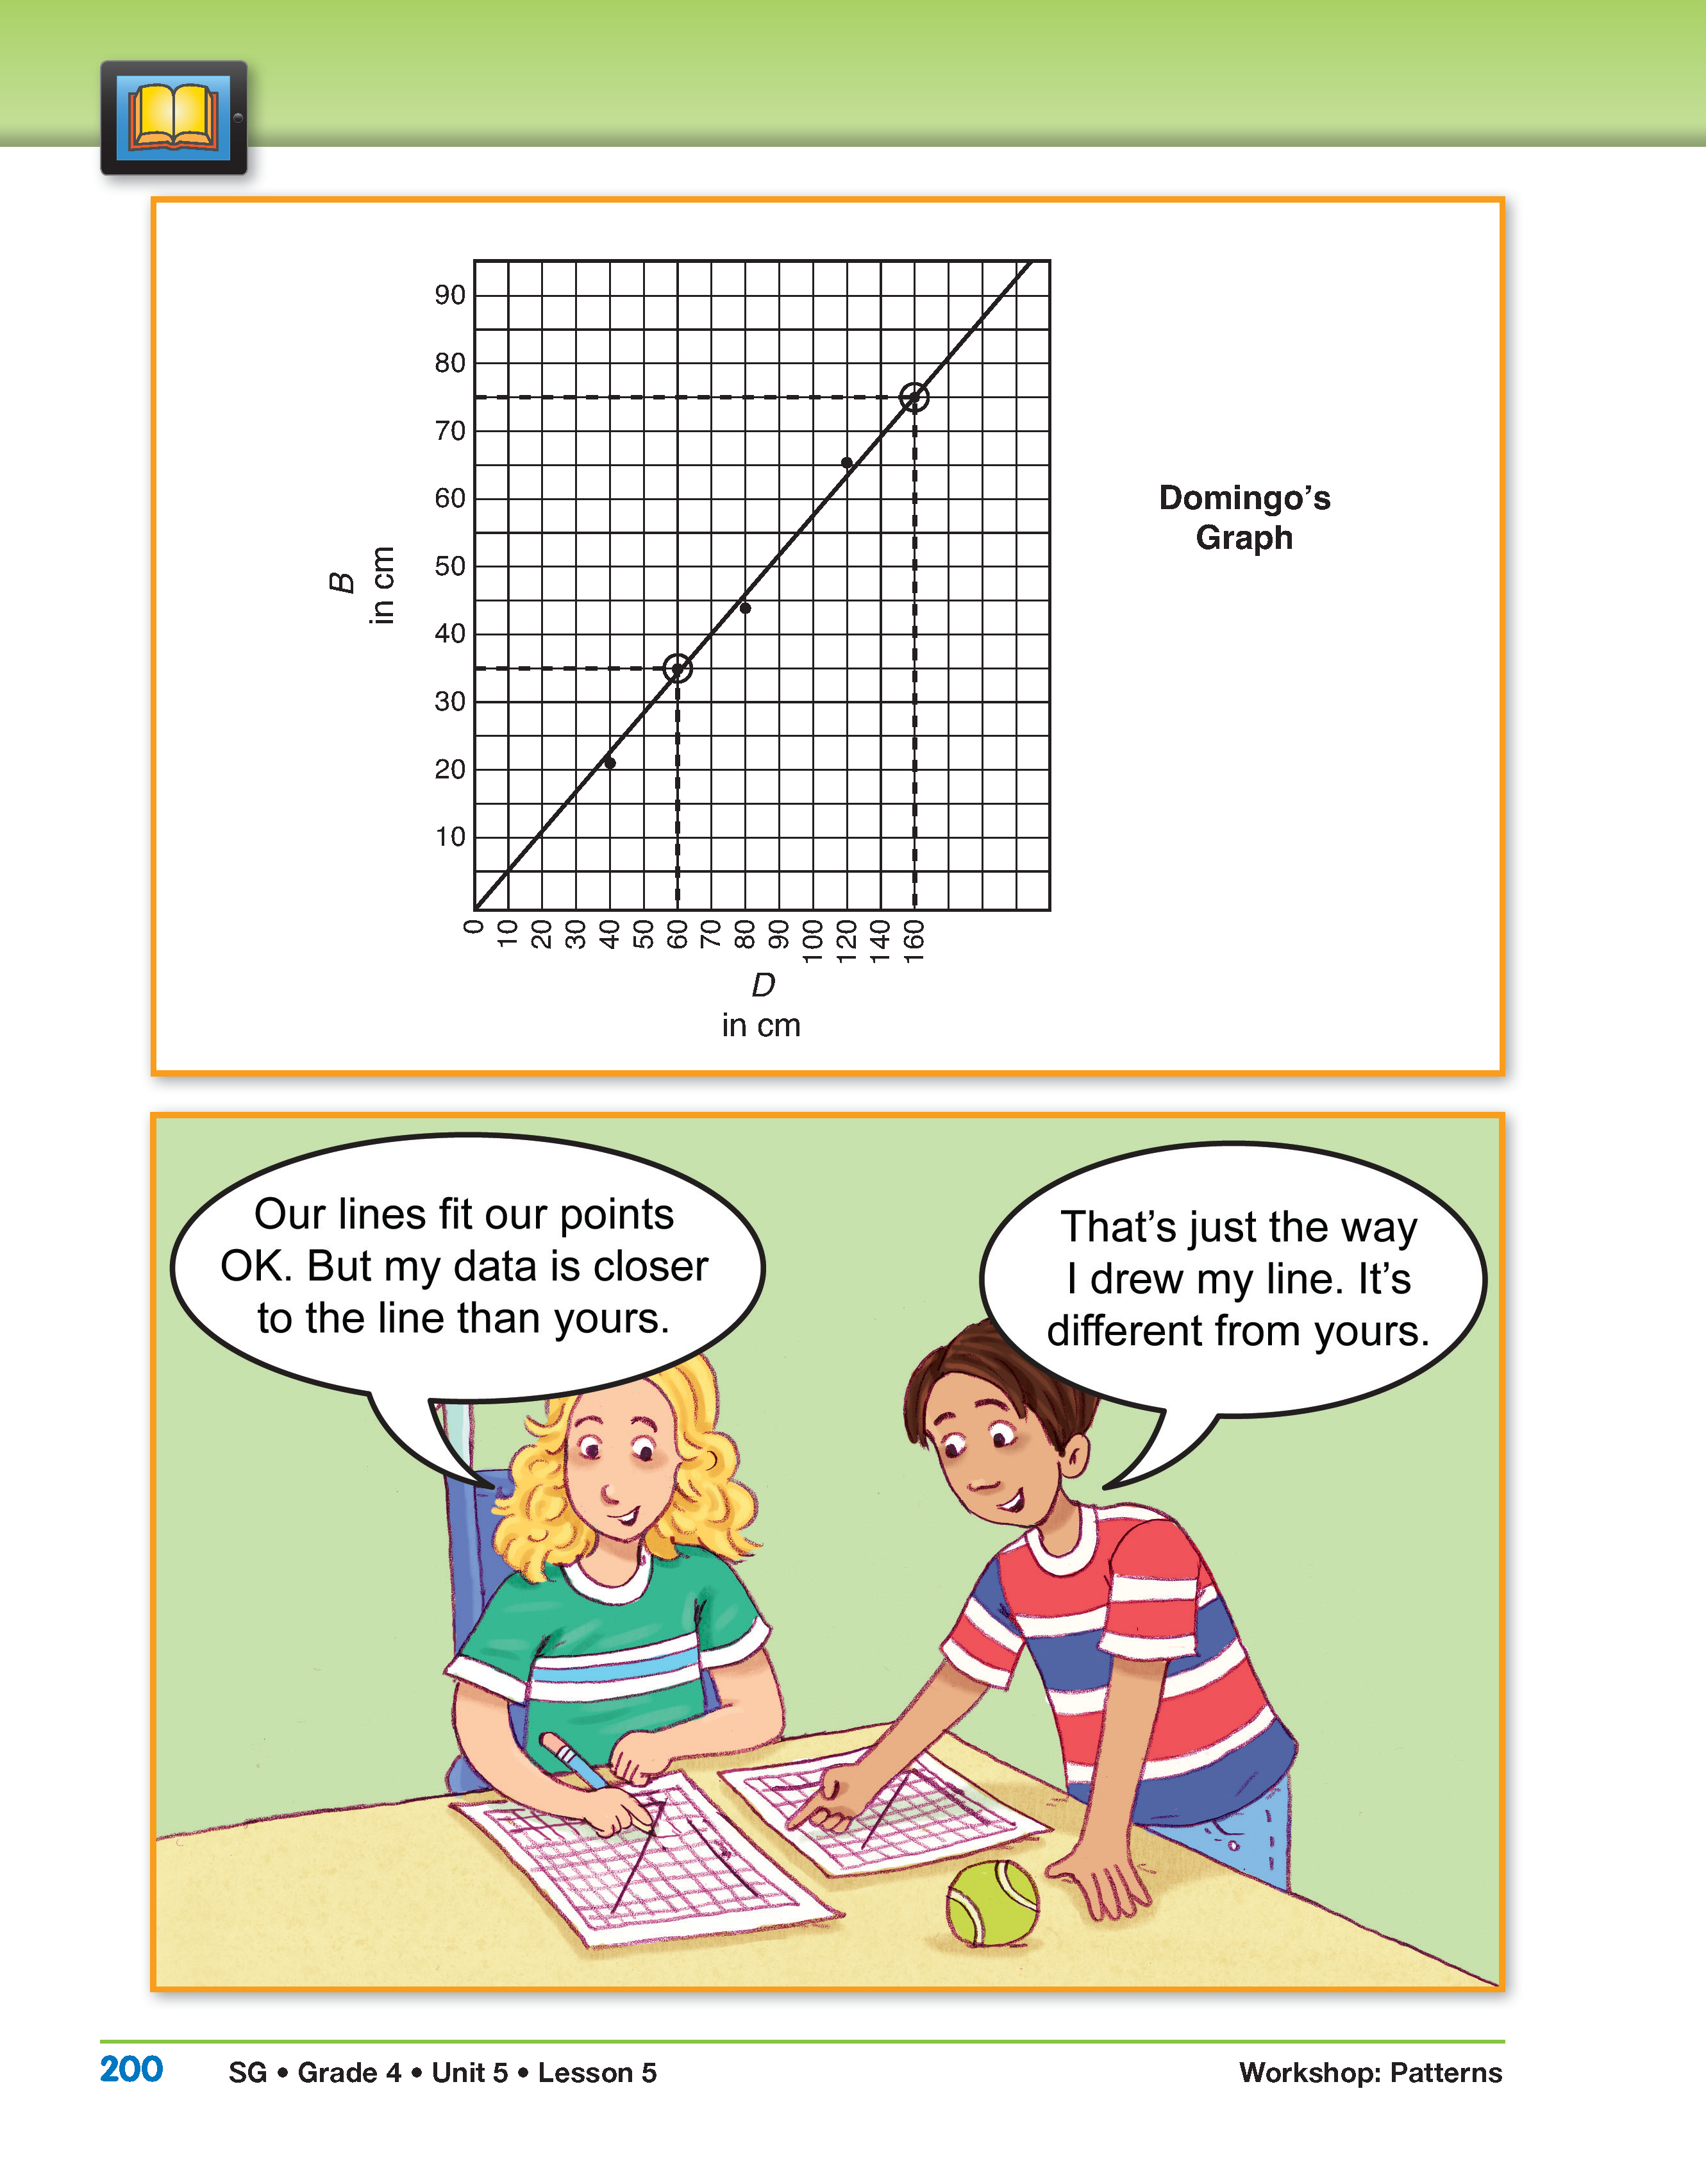
- Think about your answer to Question 5. How did you find your answer? (Possible response: First I found the drop height of 60 cm on the horizontal axis. Then I went up to my best-fit line and read across to the bounce height and got 35 cm.)
- Was your prediction closer to Sharon's or Domingo's? (Possible response: My prediction was close to both Sharon's and Domingo's because their predictions were close together.)
- How did you make your prediction in Question 6? (Possible response: I used my best-fit line. I went up from 160 cm and then across to the bounce height and got 88 cm.)
- Was your prediction closer to Sharon's or Domingo's prediction? (Responses may vary but student predictions should be closer to Sharon's prediction of 88 cm.)
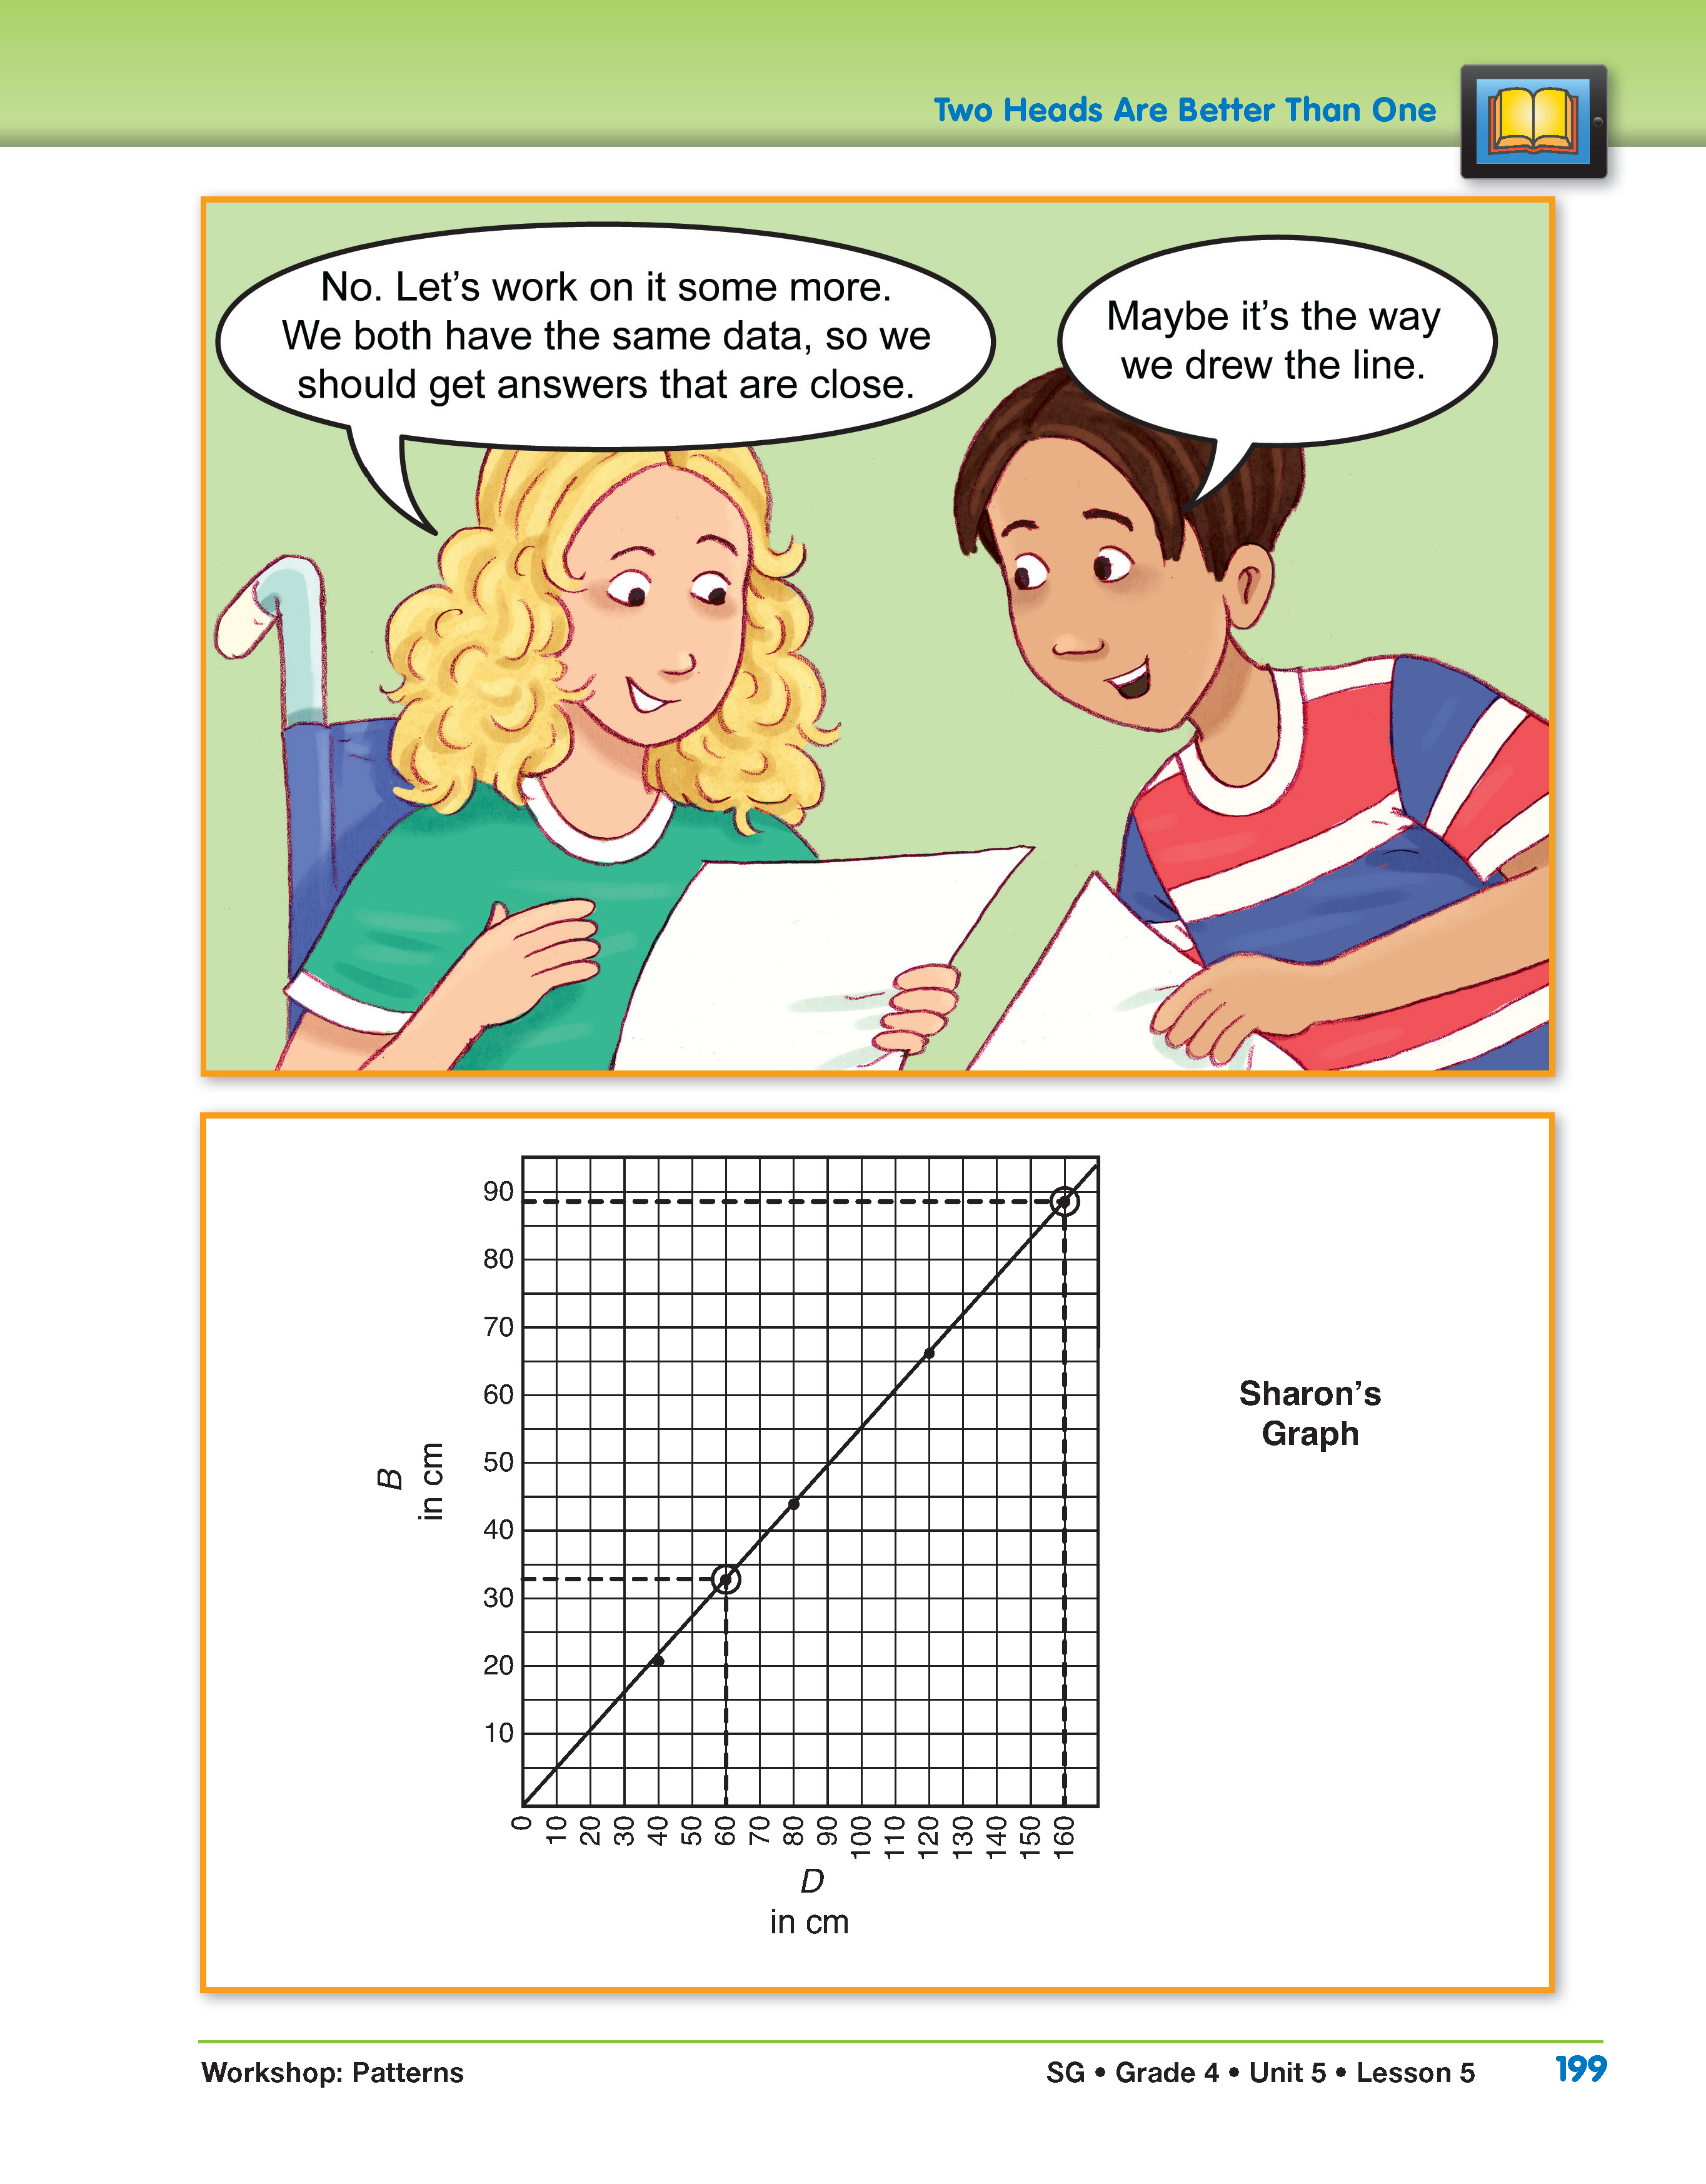
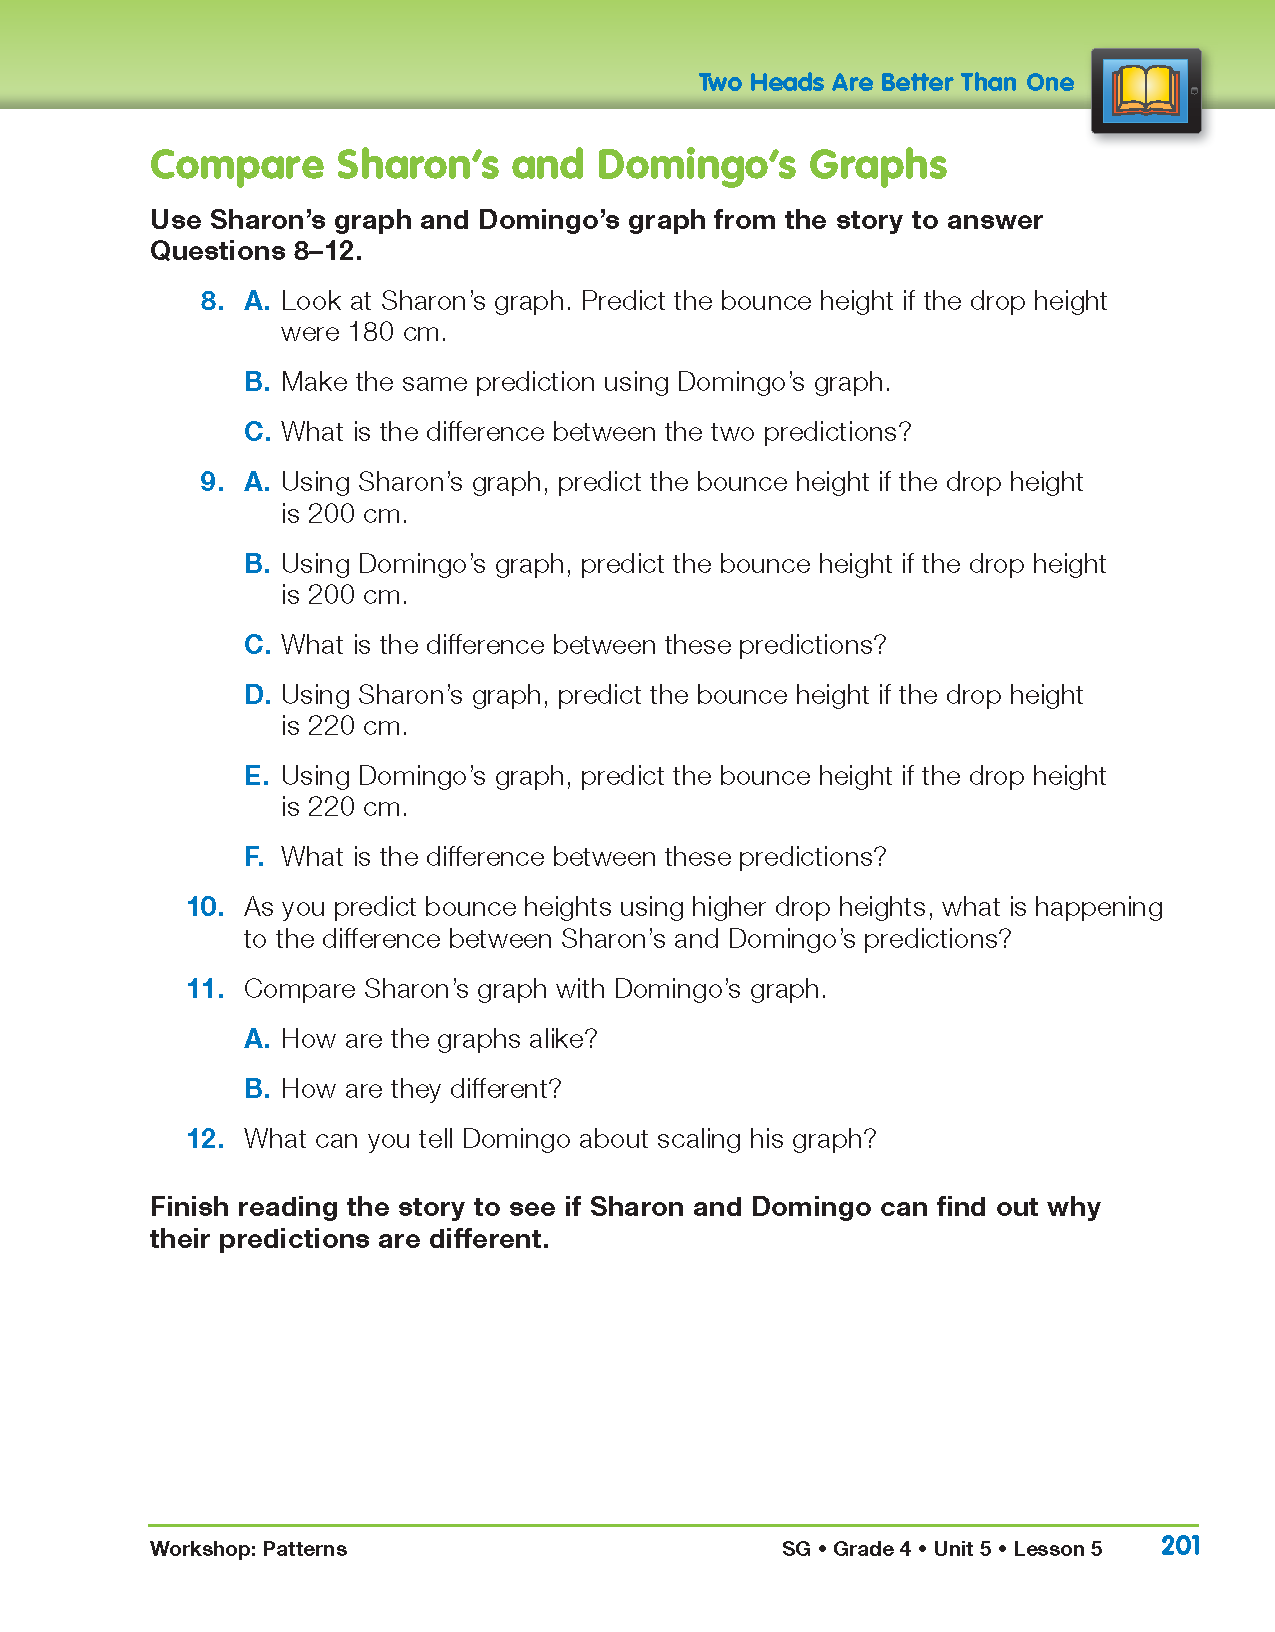
Compare Sharon's and Domingo's Graphs. Refer students to and display Sharon's Graph and Domingo's Graph in the story in the Student Guide. Ask students to use these graphs to answer Questions 8–12 in the Student Guide.
If some students are having difficulty answering the questions, use the following discussion prompts to help guide their thinking:
- Find the drop height on the horizontal axis of the graph. How can you use that and your best-fit line to find the bounce height? (Once you find the drop height you go up to the best-fit line and then read across to the vertical axis to find the bounce height.)
- The predictions you get with Sharon's graph are different from the ones you get with Domingo's graph. When you compare the graphs what are the important things to look for? (Did they plot the points correctly? Did they use the same scale on the horizontal axis and the vertical axis? Did they draw their best-fit lines accurately?)
- How did Sharon and Domingo scale their graphs for the bounce height? Drop height?
Finish reading the story together as a class to see if Sharon and Domingo can discover why their predictions are different.


