Bouncing Ball
Est. Class Sessions: 4–5Developing the Lesson
Part 4. Exploring the Data
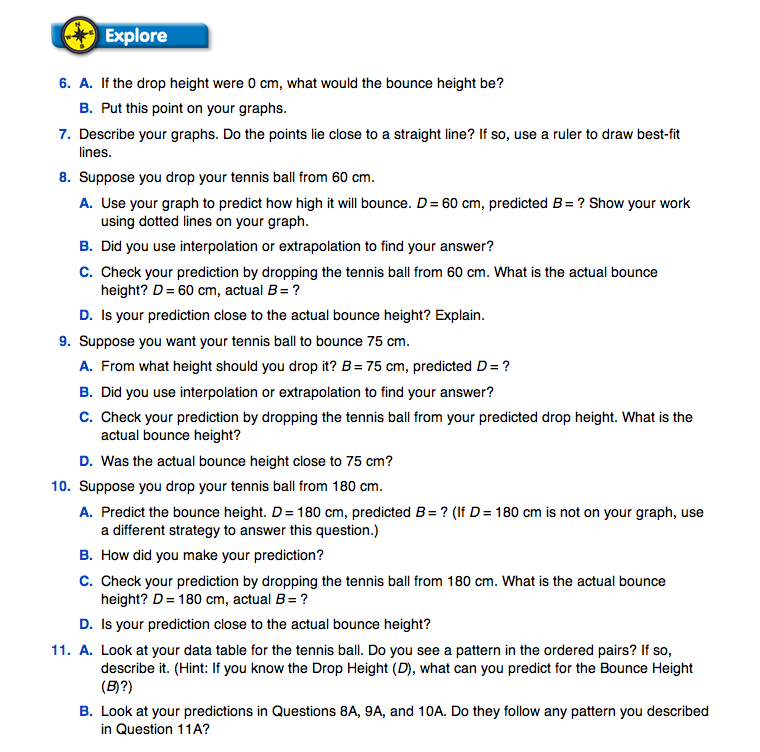
Draw a Best-Fit Line. Questions 6–7 in the Explore section of the Student Guide help students decide where to draw a best-fit line on the graph. In Question 6A students are asked to think about what the bounce height would be if you dropped the ball from 0 cm. This question may initially confuse students since in actuality this would mean you would simply set the ball on the floor. Help students to recognize that the data point that would show this will be (0, 0). Question 7 asks students to draw a best-fit line on each of their graphs. This line should begin at the data point (0, 0). Remind students that their best-fit line will probably not go through each data point. It will probably have some points above it and some below. The points above should be about as far away from the line as the points below. The graphs in Figures 4 and 5 show the best-fit line for the bounce height of the tennis ball and the SuperBall®.
Use the Graphs to Make Predictions. Questions 8–10 ask students to make predictions about the tennis ball using their data and then to check the predictions using the same equipment. We recommend that groups make their predictions for all three questions first, then check them all at one time (Questions 8C, 9C, and 10C).
Before students check their predictions, ask the class to make a list of all the variables that must be held fixed as they drop the balls and measure the bounce heights. Using the same ball is especially important.
Question 8A asks students to predict the bounce height of their tennis balls if they are dropped from a height of 60 cm. As shown on the sample graph in Figure 4 with dotted lines and arrows, one student predicted that his ball would bounce to a height of 32 cm. This is interpolation since 32 cm lies between the data points on the graph (Question 8B). To check the prediction (Question 8C), students should drop the same ball from 60 cm and measure the bounce height. Question 8D asks if the predicted height is close to the actual bounce height. If, for example, the actual bounce height is 34 cm, students might reasonably conclude that the prediction is indeed “close.”
As students discuss their results, ask:
In Question 9A, students are asked to predict the drop height of their tennis balls when the bounce height is B = 75 cm. This is extrapolation (Question 9B) since 75 cm is beyond the original data points. The graph in Figure 4 shows the extrapolation process which begins at 75 cm on the vertical axis and ends at 143 cm on the horizontal axis. If a student checked the prediction (Question 9C), by dropping the same ball from 143 cm and the ball bounced to 70 cm, the actual bounce height of 70 cm could be considered close to 75 centimeters. On the other hand, a bounce height of 60 cm would probably be low.
Question 10 asks students to make predictions about a height that probably is not on the graph. They will have to devise different strategies for solving this problem. Question 11A asks students to look for patterns in the ordered pairs in the tennis ball data table. For the three ordered pairs in the data table in Figure 3, B is about half of D. This pattern should hold for their predictions in Questions 8A, 9A, and 10A.
For example, ask:
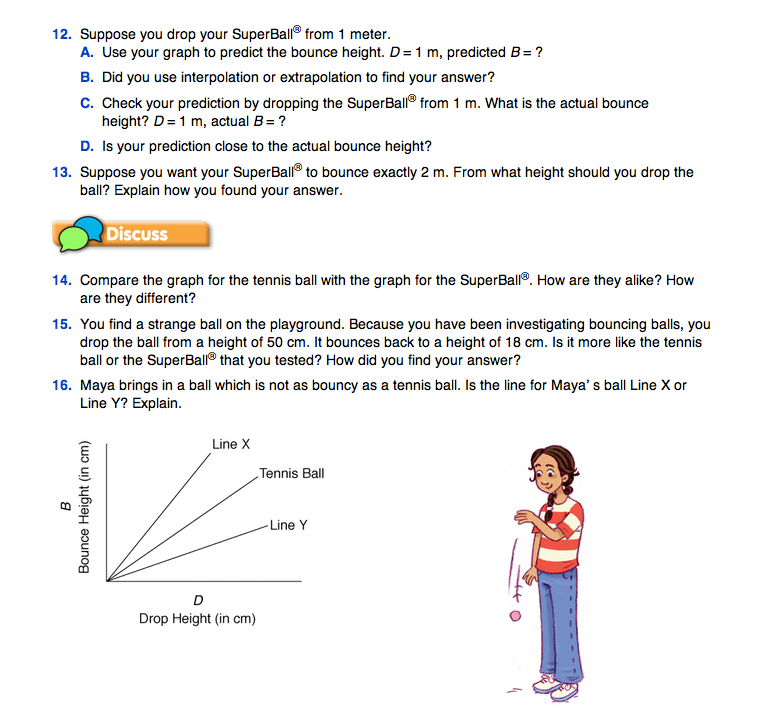
Question 12 asks students to use their graph to predict how high a SuperBall® will bounce when dropped from 1 meter. Students need to decide if they will use interpolation or extrapolation to find their answer.
In Question 13, students are asked to make a prediction about the drop height of the SuperBall® when the bounce height is 2 m. Since this data point is not included on the graph, students will not be able to use extrapolation to find the answer.
Before students begin to work on Question 13, use the Math Practices page in the Student Guide Reference section to review and set expectations for their solutions. Focus on Math Practices Expectations 5 and 6. The following paragraph is a student response to Question 13. Many other strategies are possible. Ask students to share theirs with the class.
- “I knew [from Question 12] that if it [the SuperBall®] bounced to 1 meter the drop height would be 130 cm, but I needed 2 meters so I doubled it and I got 260 cm.”
Ask students to share their solutions with the class. As students share their solutions, provide feedback on how well students are meeting the Math Practices Expectations based on students' written responses to Question 13.


