


Workshop: Patterns
Est. Class Sessions: 2Developing the Lesson
Part 2. Workshop
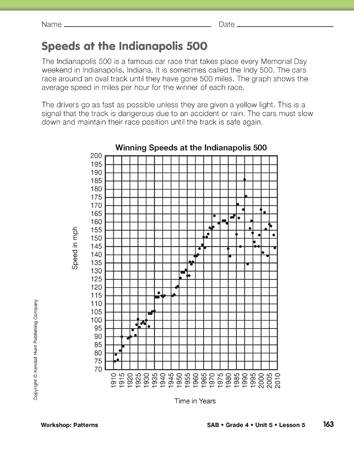
Speeds at the Indianapolis 500. Introduce students to the problems in the Speeds at the Indianapolis 500 section on the Using Patterns in Data pages in the Student Activity Book. Ask a volunteer to locate Indianapolis on a map and then ask the class to read and discuss the vignette and graph.
Ask:

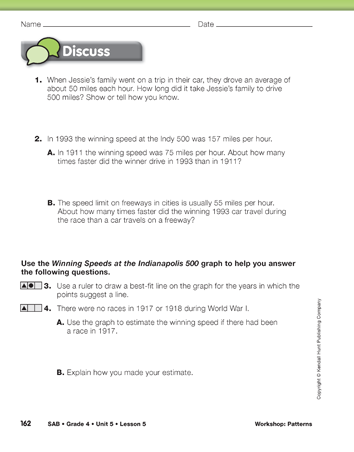
Discuss Questions 1 and 2 with the class so students can get a sense of the speeds they normally travel in a car and the winning race speeds represented in the graph.
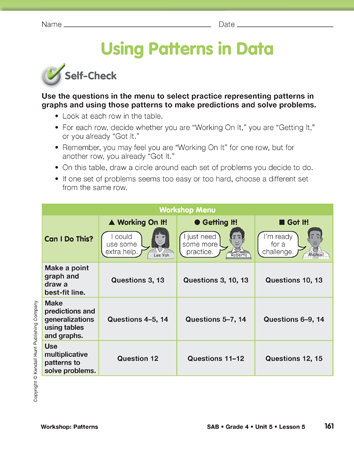
Set Up the Workshop. Refer students to the menu on the Using Patterns in Data pages in the Student Activity Book. Have students think about the questions in the left-hand column of the menu. Ask students to review their work on Questions 1–7 in the Student Guide and other work from this unit to decide which problems to choose from the following groups:
- Students who are “working on it” and need some extra help should circle the problem set marked with a triangle (
 ). These problems provide scaffolded support for developing the essential underlying concepts as well as some opportunities for practice.
 - Students who are “getting it” and just need more practice should circle the problem set marked with a circle (
 ). These problems mainly provide opportunities to practice with some concept reinforcement and some opportunities for extension.
 - Students who have “got it” and are ready for a challenge or extension should circle problems marked with a square (
 ). These problems provide some practice and then move into opportunities for extension.
Note that students' self-assessment of their own abilities may vary between rows in a menu or between menus. For example, a student might circle the “![]() ” questions in one row and the “
” questions in one row and the “![]() ” or “
” or “![]() ” questions in another row or in a subsequent menu. A student's comfort and ability may vary by Expectation, and the workshop allows each student to choose problems flexibly based on what type of practice he or she needs for each “Can I Do This?” question.
” questions in another row or in a subsequent menu. A student's comfort and ability may vary by Expectation, and the workshop allows each student to choose problems flexibly based on what type of practice he or she needs for each “Can I Do This?” question.
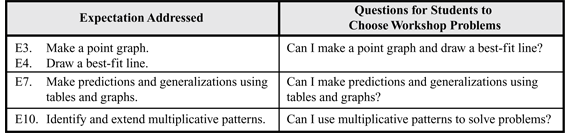
The practice in this workshop addresses the Expectations shown in Figure 2.
Check students' choices to see how well they match your own assessment of their progress on the related Expectation(s). Help students make selections that will provide the kind of practice they need.
Workshop. Match groups of students who have chosen similar sets of problems from the menu. Have students work with their groups to solve the problems they chose. (Minis of Student Activity Book pages not shown here are in the Answer Key.) Again, flexibility is important. If problems seem either too easy or difficult for students, they should adjust their choices from the menu. Students may need to work with different groups of students as they progress through the different sections of the workshop.
Tell students that they will be using data about the Indianapolis 500 to practice representing and using data to make predictions and make generalizations.