


N. Buying a New Car 


The table shows the price of the same model of a new car from 1985 to 1995.
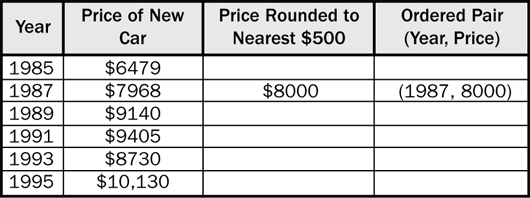
- Round each price to the nearest $500. Fill in the ordered pairs.
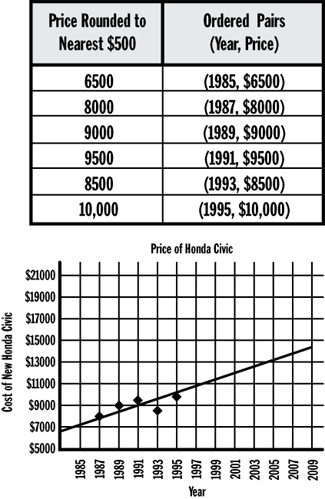
- Use the rounded numbers to make a point graph of the data on a piece of Centimeter Graph Paper.
- Use a ruler to draw a best-fit line.
- In which year did the price of this car model not go up? Did this data point change how you drew your best-fit line? If so, how did it change it? Write your answers on a separate sheet of paper.
- The price of the same model car in 2009 is $15,505. Does this price fall on the best-fit line you drew? If it is not on your line, is it close?