Read the vignette at the beginning of the Using Ratios Pages in the Student Guide with the whole class.
Begin a discussion using Questions 1–2. To help students identify patterns in the data, ask:
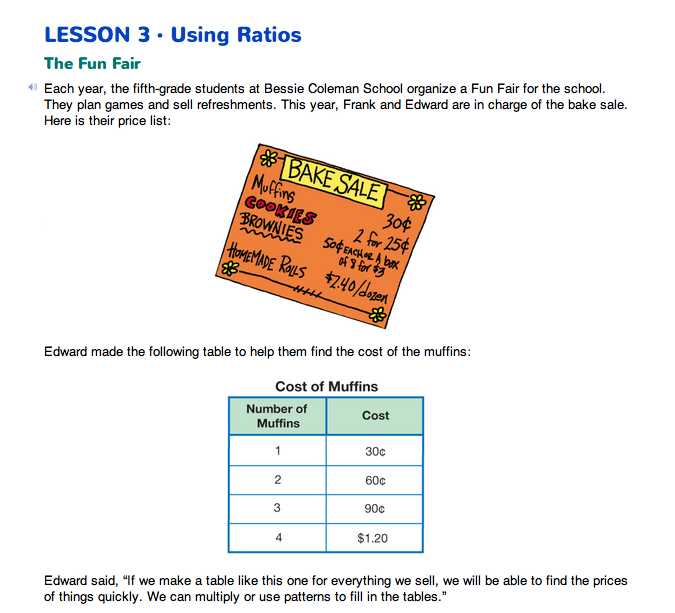
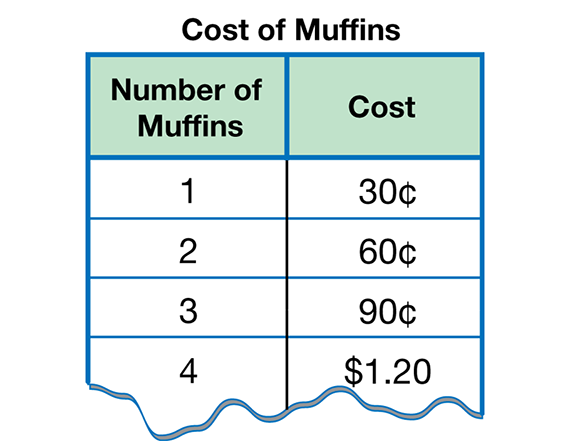
- What happens to the total cost as the number of muffins changes? (When the number of muffins goes up, the cost goes up.)
- Is there a pattern in the amount the cost goes up for each muffin? Look for patterns going down the columns. (Students may notice that the numbers in the second column increase by 30 each time. They may express the pattern as “multiples of 30.” They may also say that doubling the number of muffins doubles the cost, tripling the number of muffins triples the cost, etc.)
- Look for patterns going across the rows. (Each muffin costs 30¢ so the cost of the muffins is always the number in the first column times 30¢. The number of muffins is the cost divided by 30¢.)
- Explain how you would find the cost for 10 muffins. (Using multiplication, 10 × 30¢ = $3.00. Students may also skip count by 30¢ intervals.)
Question 3 asks students to compare the patterns in the table to the patterns in the graph. Use the Cost of Muffins Data Table and Cost of Muffins Graph Masters to display and discuss the table and review how to plot points for table entries. See Figures 1 and 2.
- Which axis represents the values in the left column of a table? (the horizontal axis)
- Which axis represents the values in the right column of a table? (the vertical axis)
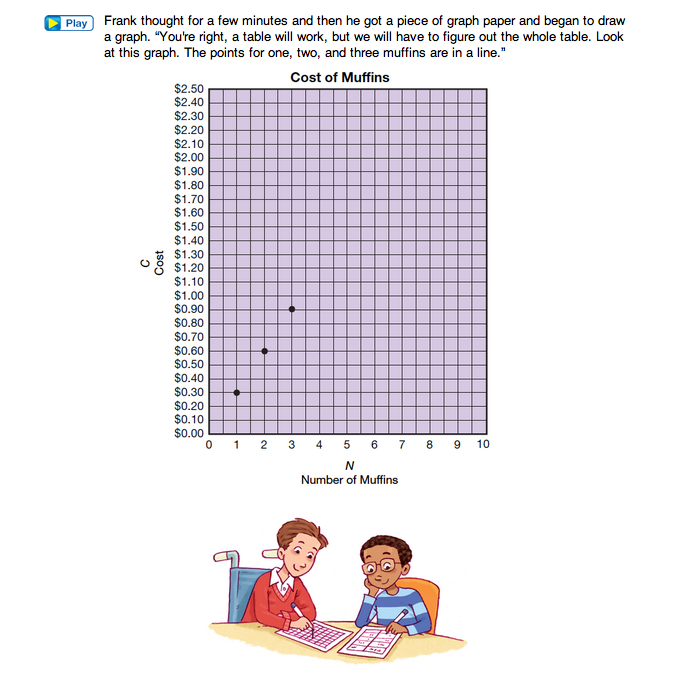
- Explain how Frank plotted the first point from Edward's table onto the graph. (He found the location of 1 muffin on the horizontal axis, then moved upward to the value of $0.30 on the vertical axis and plotted the point at that location.)
- What patterns do you see in Frank's graph? (Responses may vary. Students may notice that each point moves a value of 1 muffin to the right and $0.30 up from the point before it. Students may describe the points as lying on a straight line that goes up and to the right.)
- Why does the line drawn through the points pass through the origin? (Zero muffins cost zero dollars.)
Cents. As students answer questions that involve writing cents, make sure they write the cents appropriately. Thirty cents can be written as 30¢ or $0.30, not 0.30¢.
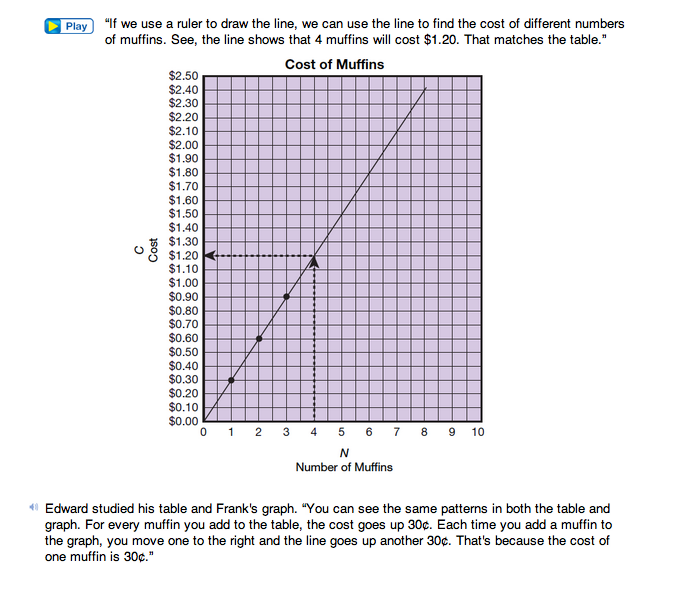
Draw a line on the display of the Cost of Muffins Graph Master to fit the points on the graph. Emphasize the importance of using a ruler to draw a straight line. Figure 2 shows how to use the line to find the cost of seven muffins and the number of muffins a customer can buy for $1.50 (Question 4).
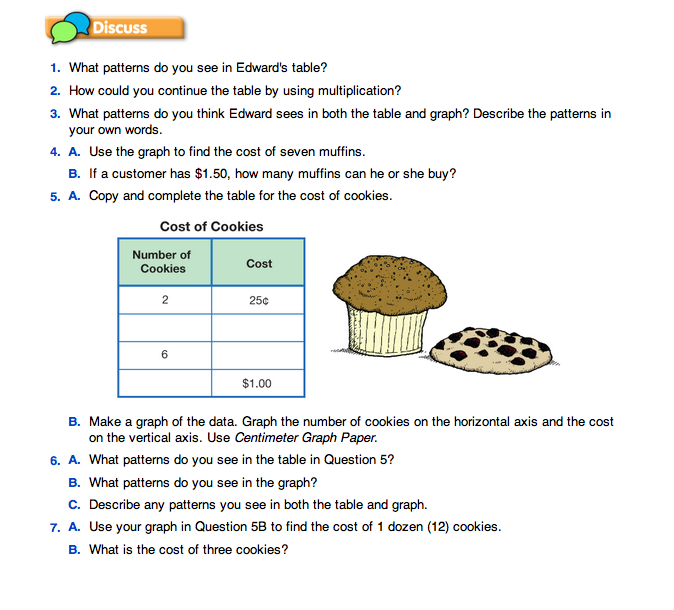
Questions 5–7 ask students to repeat the same process for a different ratio (2 cookies for 25¢). Students build a table, plot points, look for patterns, fit a line, and use the graph to answer questions. See Figure 3. As students work through these problems, encourage them to describe their solution strategies and any patterns they observe. Question 7B illustrates the limitations of using the line to find prices. Drawing a line implies that all of the points on the line, including those which correspond to fractions of a cent or fractions of a cookie, make sense. However, the point on the line corresponding to three cookies shows a cost of 371/2¢. Since it is not possible to collect a half penny, charging 371/2¢ is not realistic, so the students at the bake sale would probably charge 38¢.

Ratios. A ratio is a comparison of two numbers, usually expressed as a quotient. For example, “twenty miles per gallon” is a ratio, namely “twenty miles to one gallon.” We often write ratios as fractions, such as 20 miles/1 gallon. “Indicated quotient” means that the division is not actually performed (unless needed). For example, you might find that the ratio of miles to gallons for your car is 160 miles/8 gallons. When you carry out the division of 160 by 8 you see that this ratio is the same as 20 miles/1 gallon. This is one example of a general rule for telling when two ratios are equal.
Two ratios are equal if the fractions are equivalent. Alternatively, two ratios are equal if the results of the divisions are the same. For example, $3/4 pumpkins = $9/12 pumpkins because the fractions 3/9 and 9/12 are equal. Alternatively, dividing 3 by 4 and dividing 9 by 12 both give 0.75.