Distribute copies of the Centimeter Graph Paper Master in Lesson 2 and assign Questions 7–9. Students use the ordered pairs from the data table to graph time (T) on the horizontal axis and distance (D) on the vertical axis. Question 8 asks students to give the measurements for time and distance when the walker crosses the starting line and to add this point to their graphs. When the walker crosses the starting line, the distance traveled is 0 yards and the stopwatches should read 0 seconds. Students should use a ruler to fit a line using all four points (Question 9). Figure 2 provides sample graphs corresponding to the data tables in Figure 1.

Best-fit Lines. A best-fit line is the line that comes as close as possible to each point. To fit a line, try to get as many points above the line as below it. Extend the line in both directions to be able to extrapolate (make predictions beyond the data). Many data sets can also include point (0, 0) as well. The context helps determine if this point can be represented. For example, at zero time the walker has walked zero distance. In some situations the point (0, 0) does not make sense. For example, in the graph in Figure 3 representing Nila's sit-ups, it does not make sense to talk about the point (0, 0), since infants cannot do sit-ups.
Students use a ruler (preferably clear) to experiment with the various angles, then draw it using a pencil. Students can also experiment with a piece of string or spaghetti but should use a ruler to draw the line. Each student will draw the line a little bit differently and use it to make predictions. This will result in differing predictions. However, you can expect the lines and predictions to be relatively close.

Use Student Guide Questions 7–9, the graph, and the Distance vs. Time Feedback Box in the Student Activity Book to assess students' abilities to make a point graph and draw a best-fit line [E7].
If you have a few students who are new to Math Trailblazers, you can pair them with students who have drawn best-fit lines in fourth grade, and the experienced students can serve as peer tutors.
Students started drawing best-fit lines in Grade 3 Unit 12 Measurement and Patterns. In Grade 4, they analyzed many different types of graphs to determine when and where to draw a best-fit line for a given data set. Students have also drawn best-fit lines in the previous lessons in this unit.
To emphasize the important considerations in graphing the data, show the class a display of the How Can the Graph Be Improved Master.
- How would you improve the graph? (Distance should be shown on the vertical axis and time on the horizontal axis; the line should be drawn with a ruler; units should be shown on the time axis; the best-fit line should pass through (0, 0); a title should be given to the graph.)
Note that the four data points plotted on sample Graph A lie directly on a straight line, so the best-fit line goes through all four points. However, since the four points on sample Graph B suggest a line but do not fall exactly on a line, the best-fit line in Graph B goes through (0, 0) but falls between the other three points. It is likely that different groups will produce different graphs.
Have students look at their graphs and answer Question 10.
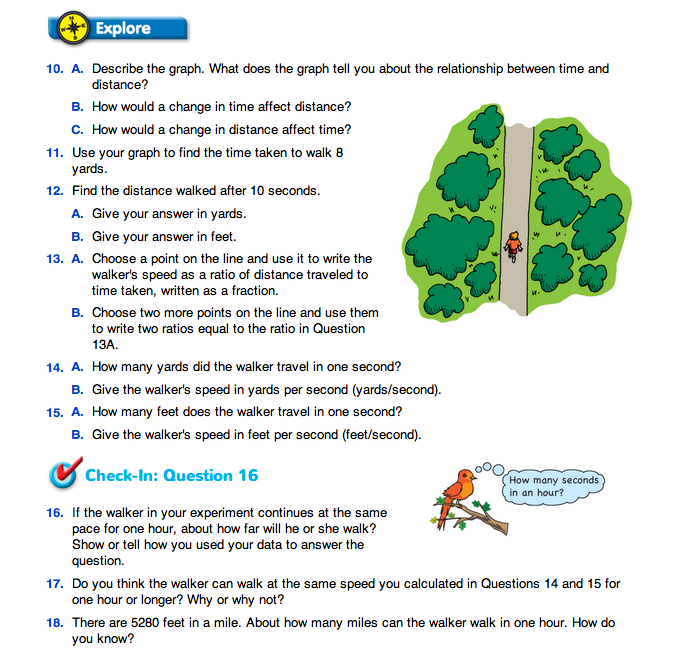
- Describe the graph. Is it a straight line? Where does it start? Does it go uphill or downhill? (Possible response: It is a straight line that starts at (0, 0) and goes uphill.)
- What does the fact that the graph “goes uphill” tell you about the change in the distance when the time increases? (When the time increases, the distance increases.)
- Use the graph to estimate how much the distance increases when time increases by one second. Each time you go over to the right one second, how much does the line go up? (Each time you move one second to the right, the line goes up about 11/2 yards.)
Use Student Guide Questions 10–18 and the Distance vs. Time Feedback Box in the Student Activity Book to assess students' abilities to describe how change in one variable in an investigation relates to a change in a second variable [E9]; make predictions and generalizations using tables and graphs [E8]; use graphs to find equivalent ratios [E3]; use ratios to solve problems [E4]; and convert among different-sized standard measurement units within a given measurement system [E6].
The Workshop in Lesson 6 provides targeted practice with these expectations.