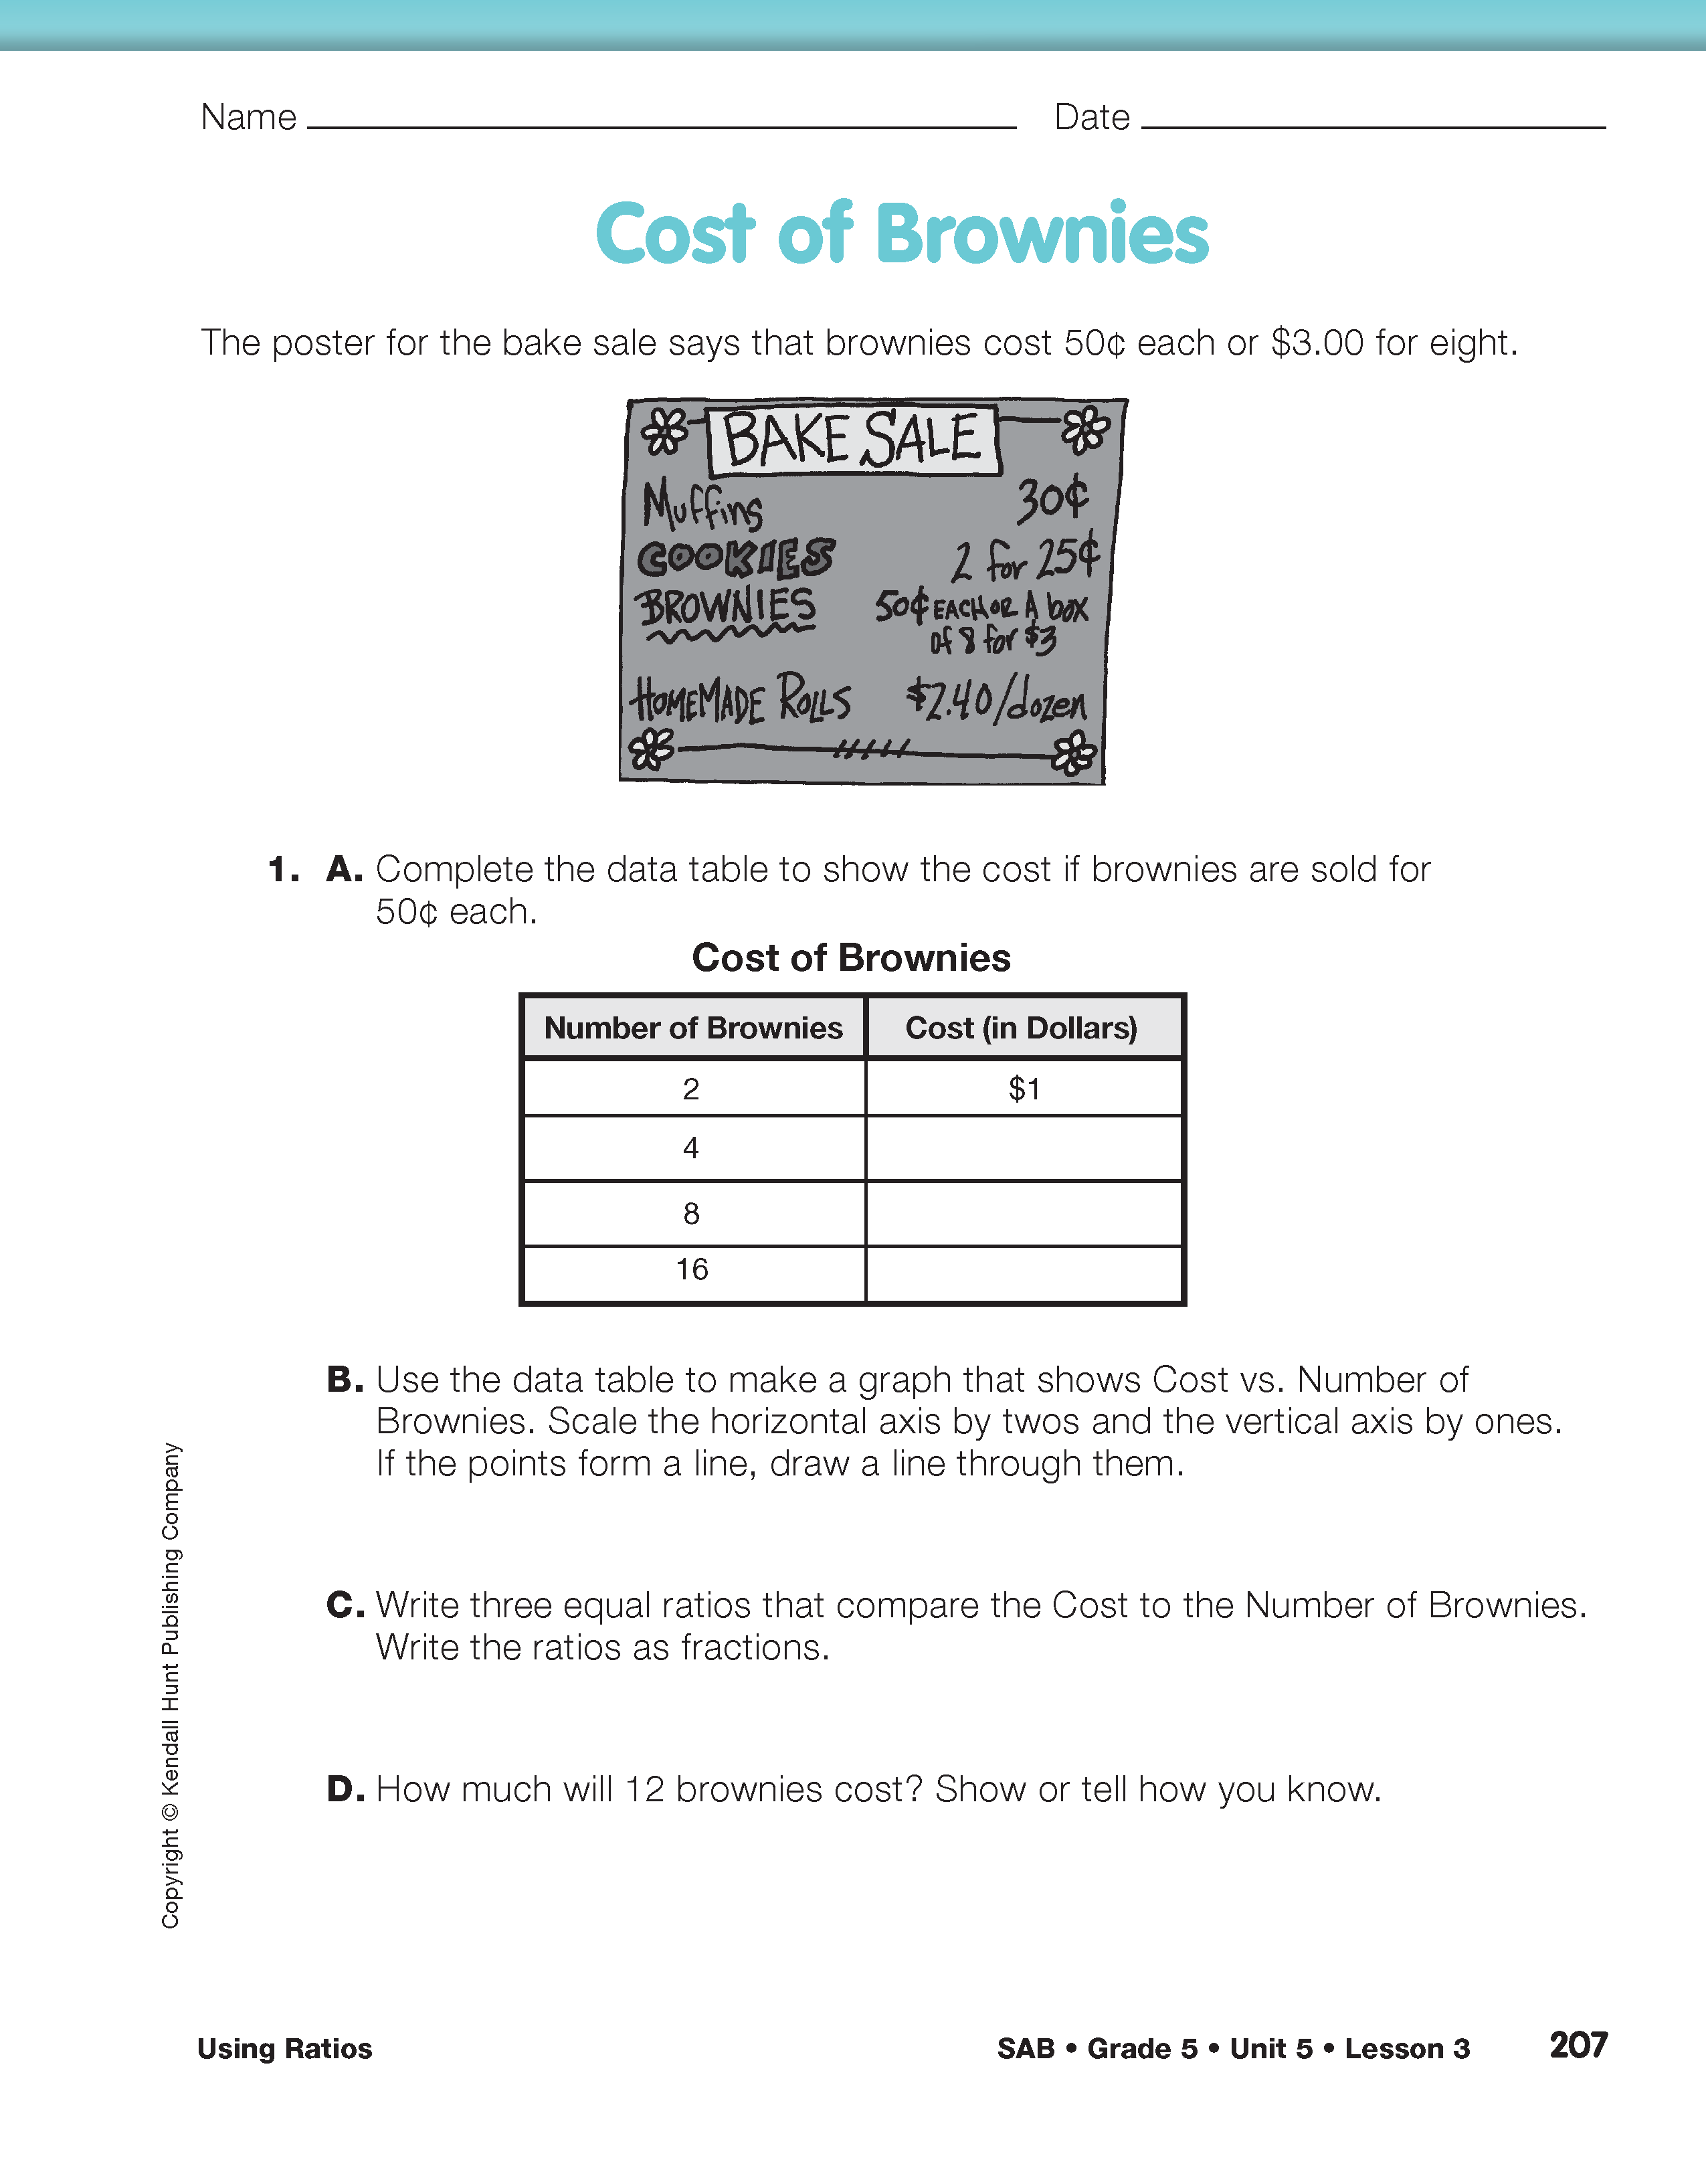
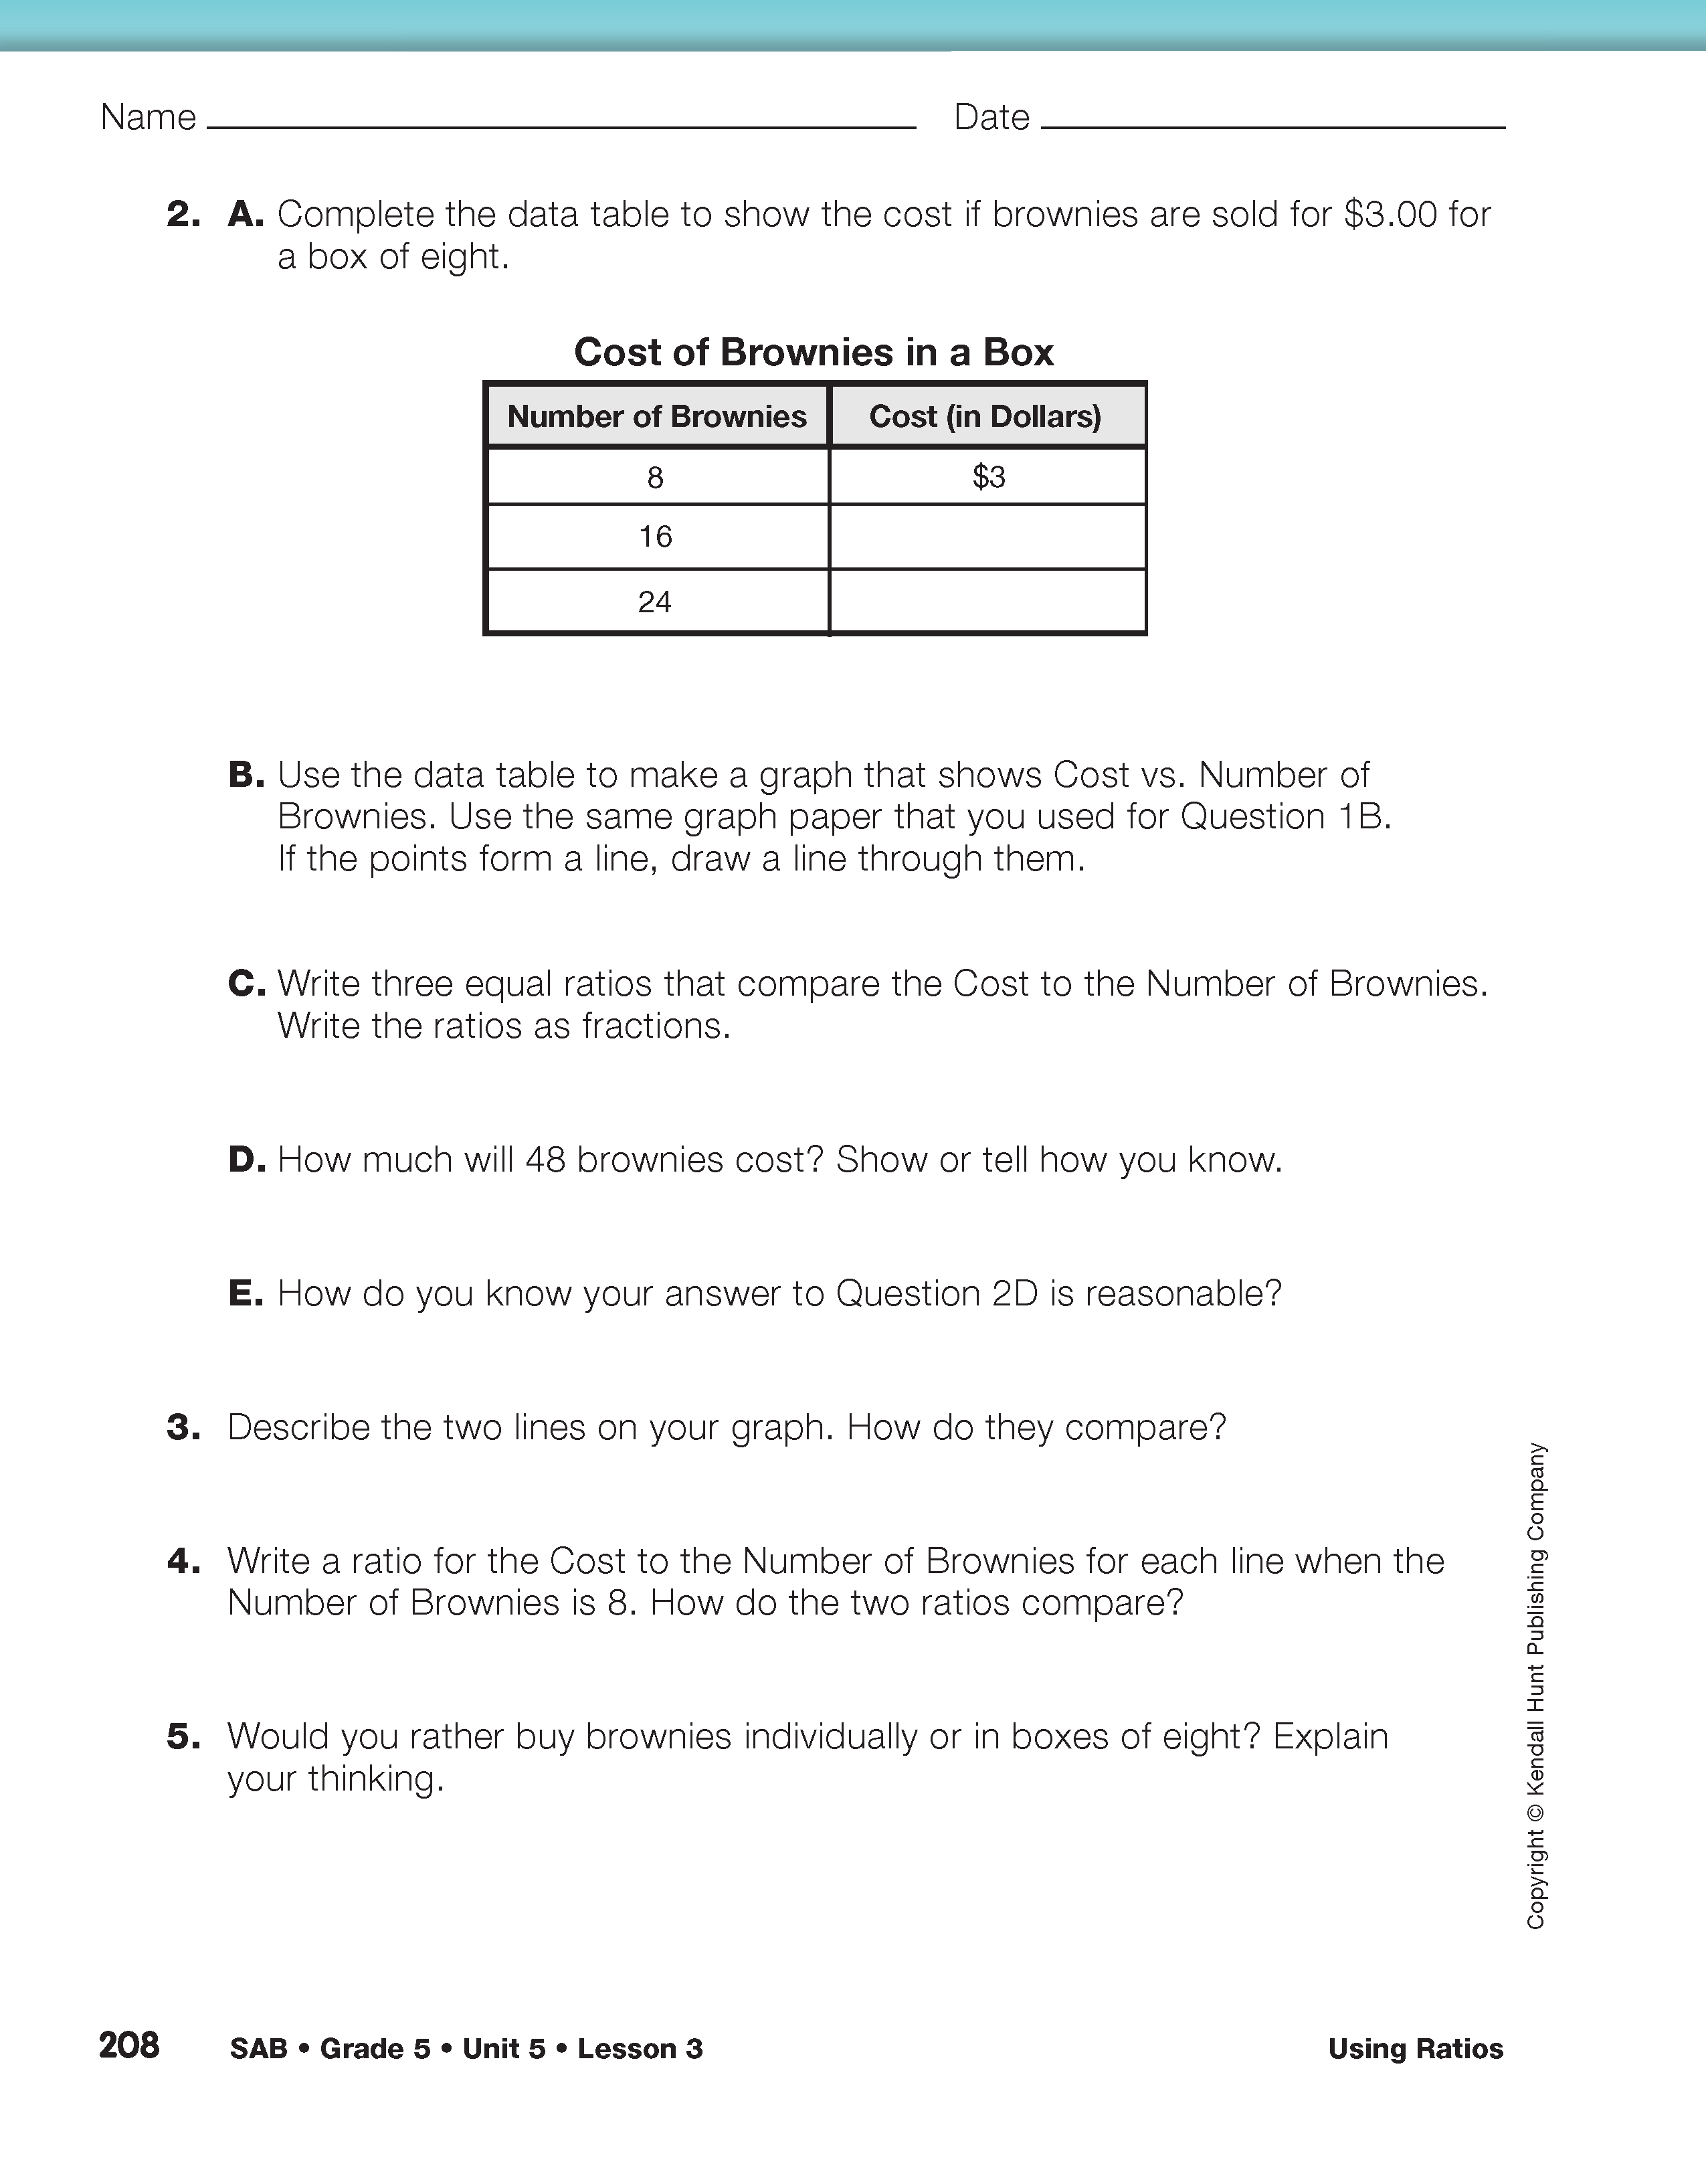
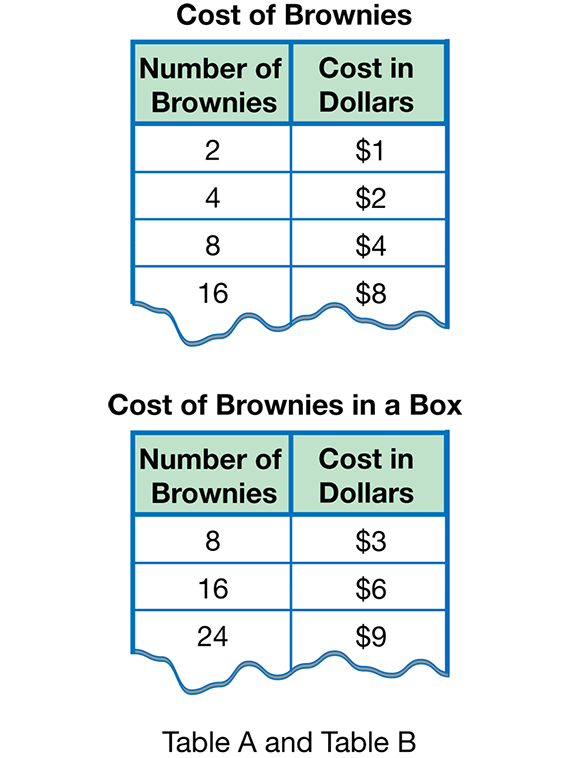
Use Questions 1–2 on the Cost of Brownies pages in the Student Activity Book to summarize the big ideas in the lesson. Students complete two data tables–one if the cost of brownies is 50¢ each and one if the cost is $3.00 for eight brownies. See Figure 4. Then they plot points and draw lines on the same graph as shown in Figure 5.
Students use the data to write three equal ratios as fractions that compare the Cost to the Number of Brownies for both sets of data (Questions 1C and 2C), and find the cost of a larger number of brownies (Questions 1D and 2D). Possible ratios for each price are shown below:
$1/2 brownies = $2/4 brownies = $4/8 brownies
$3/8 brownies = $6/16 brownies = $9/24 brownies
Use Questions 3–5 to structure a discussion for analyzing the data.
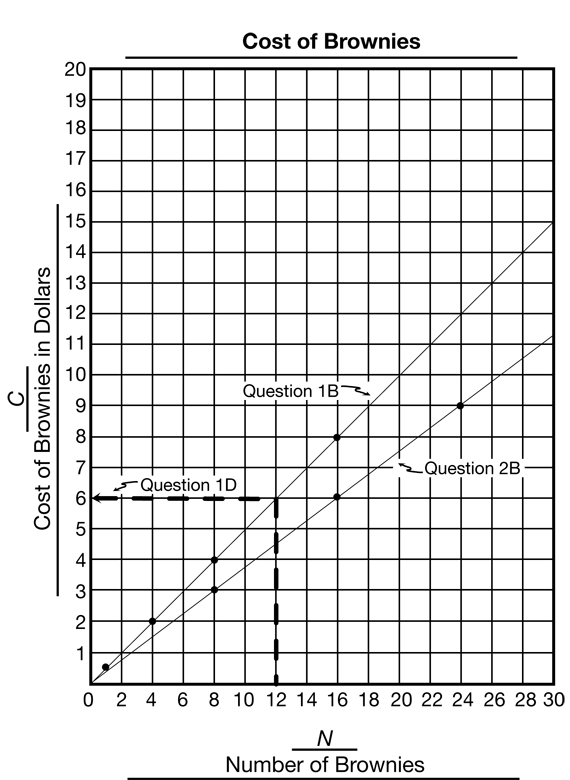
- How are the lines alike? How are they different? (Both are straight lines that start at (0, 0) and go up and to the right. One is steeper than the other.)
- Which line is steeper? (The line that shows the cost of individual brownies is steeper than the line that shows the cost of brownies in a box.)
- Use each line to find the cost of 4, 8, and 12 brownies. What does the steepness of the line tell you about the cost of brownies? (The line for Question 1, the 50¢ brownies, is always higher for each number of brownies. That means the cost is higher for those brownies all the time.)
- How would you rather buy the brownies? (Possible response: If I want a few brownies, I would spend 50¢ each, but if I want six or more, I would buy them by the box. Six brownies would cost $3.00 if bought individually, so I might as well buy a box of 8 for $3.00.)
- Would you rather build tables, draw graphs, or find equivalent fractions? Which is easiest? Why do you think so? (Answers will vary. Possible responses: Build a table because it is easy to collect the information and look for patterns at the same time. I would rather draw a graph because it is easy to read after it is finished. I would rather find equivalent fractions because it is easy and fast to multiply the numerator and the denominator by the same number.)

Use the Cost of Brownies pages with the Feedback Box in the Student Activity Book to assess how students represent and identify fractions and ratios [E1], find equivalent fractions and ratios using tools and multiplication and division stratetegies [E3], use ratios to solve problems [E4], make a point graph and draw a best-fit line [E7], make predictions and generalizations using tables and graphs [E8], know the problem [MPE1], find a strategy [MPE2], check for reasonableness [MPE3], and show work [MPE5].
The Workshop in Lesson 6 provides targeted practice.