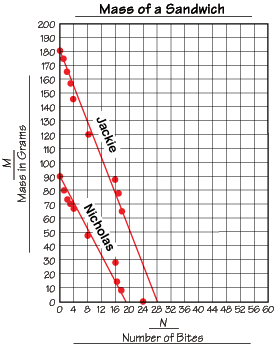
Using the TIMS Laboratory Method, students investigate the walking speed of a classmate. They review measuring length, plotting points, and drawing best-fit lines. They use the lines to find equivalent ratios and write the ratios as fractions. Students then use the ratios to solve problems.
Content in this Lesson
- Representing the variables in an investigation in a drawing.
- Using graphs to find equivalent ratios [E3].
- Describing how a change in one variable in an investigation relates to a change in a second variable [E9].
- Using numerical variables.
- Measuring length in yards and feet [E5].
- Averaging: finding the median.
- Making a point graph [E7].
- Drawing a best-fit line [E7].
- Using ratios to solve problems [E4].
- Making predictions and generalizations using data tables and graphs [E8].
- Translating between graphs and real-world events.
- Converting among different-sized standard measurement units within a given measurement system (e.g., seconds to hours, yards to feet) [E6].
- Finding a strategy for a problem and communicating how it was used to solve the problem [MPE1, 2, 5, 6].
Assessment in this Lesson
| Assessment | Expectation Assessed | Math Practices Expectation Assessed |
|---|---|---|
|
Distance vs. Time |
|
|
|
Peer Assessment |
|


