How Close Is Close Enough
Est. Class Sessions: 1–2Developing the Lesson
Part 1. Area of Irregular Shapes
Estimate Areas. To begin the activity, discuss students' strategies for finding the area of a shape with curved sides. Sketch an irregular shape on a display of Centimeter Grid Paper. Ask students to review strategies for estimating area. Make sure that the following different strategies are discussed and listed on the board or a display:
- enclosing the irregular shape in a rectangle and finding the area of this rectangle for a very rough estimate;
- counting full square centimeters and combining fractional units to make more whole units;
- enclosing the shape in a rectangle, finding the area of the rectangle, and then subtracting the estimated number of square centimeters within the rectangle that are not part of the shape;
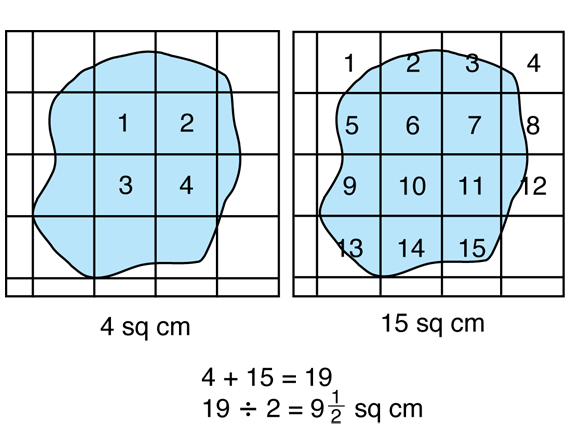
- counting all squares completely filled by the shape, counting all squares completely enclosing the shape, and then averaging these two areas. See Figure 1 for an example.
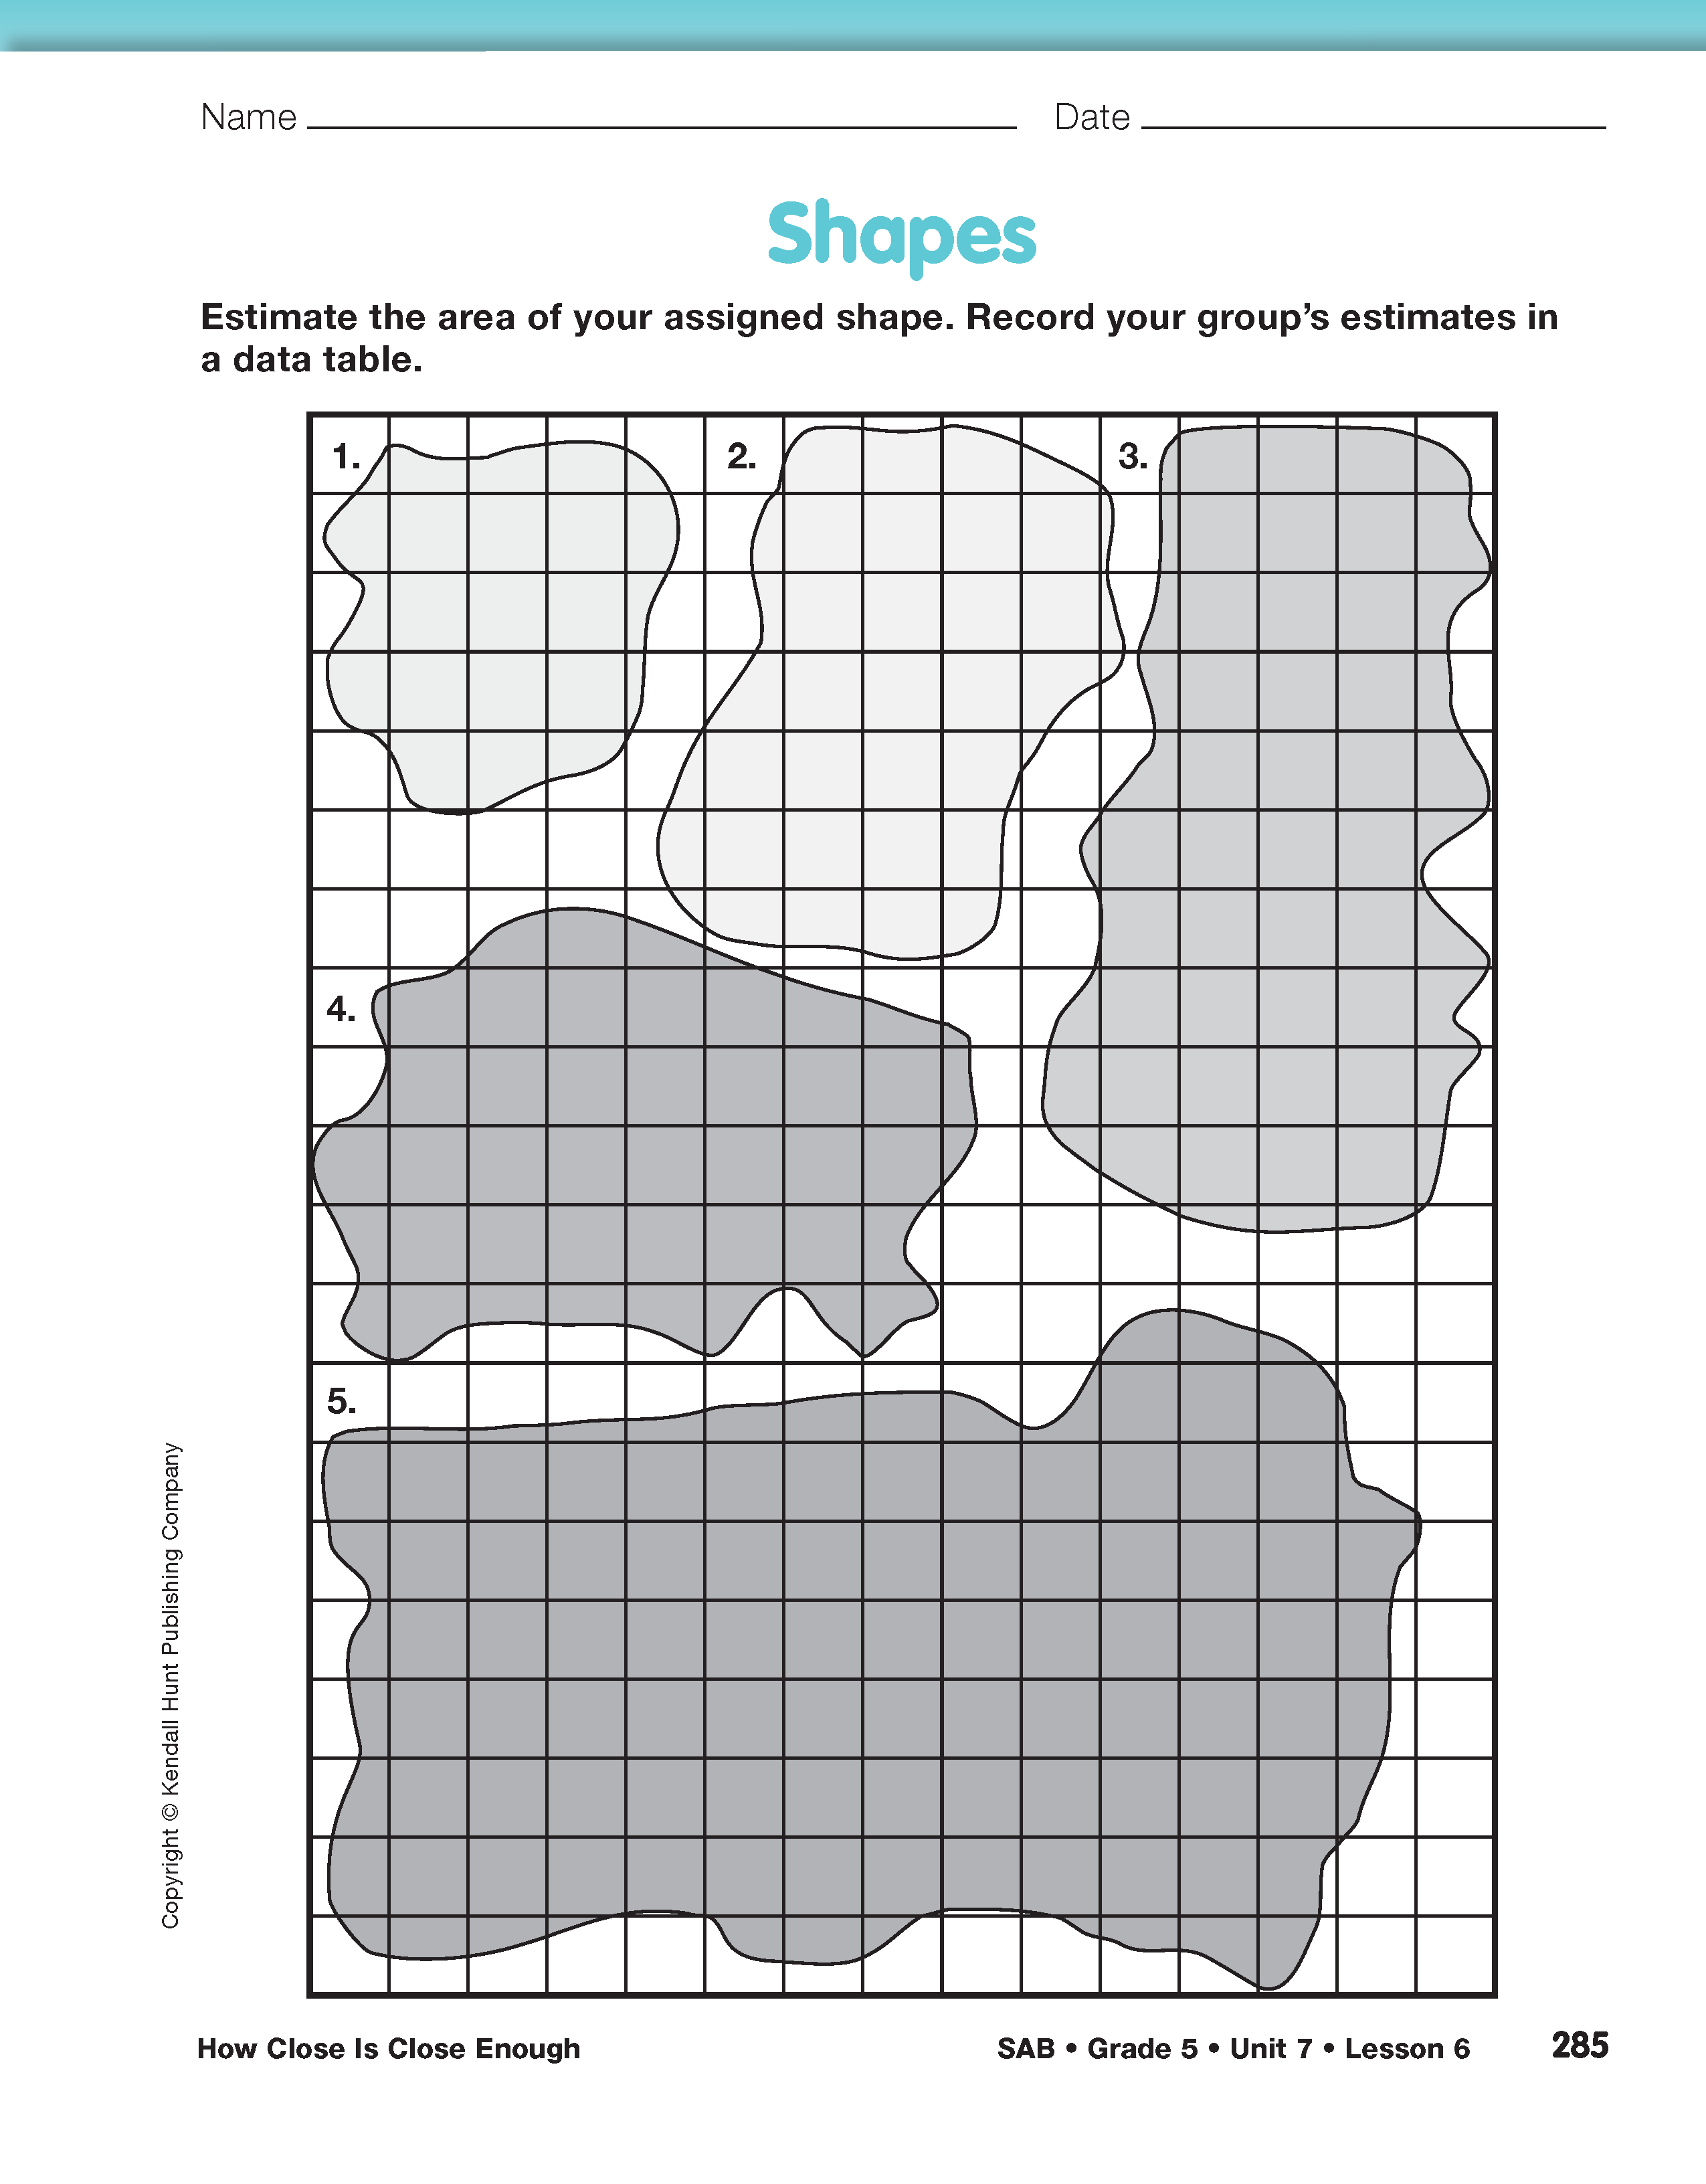
After this discussion, put students in groups and ask each group to use one of these methods to estimate the area of two shapes on the Shapes pages in the Student Activity Book. Have each group choose one large shape and one smaller shape. Make sure that at least two groups are estimating the area for each shape.
Each student in the group should independently make estimates of the areas of the two shapes. The group members share their measurements by recording them in a data table. Student groups can hand draw the data tables or use copies of the Two-Column Data Table Master. See Figure 2.
Once all the members have recorded estimates, the group finds the median estimated area for their shapes. Instruct them to record this information at the top of their data table.
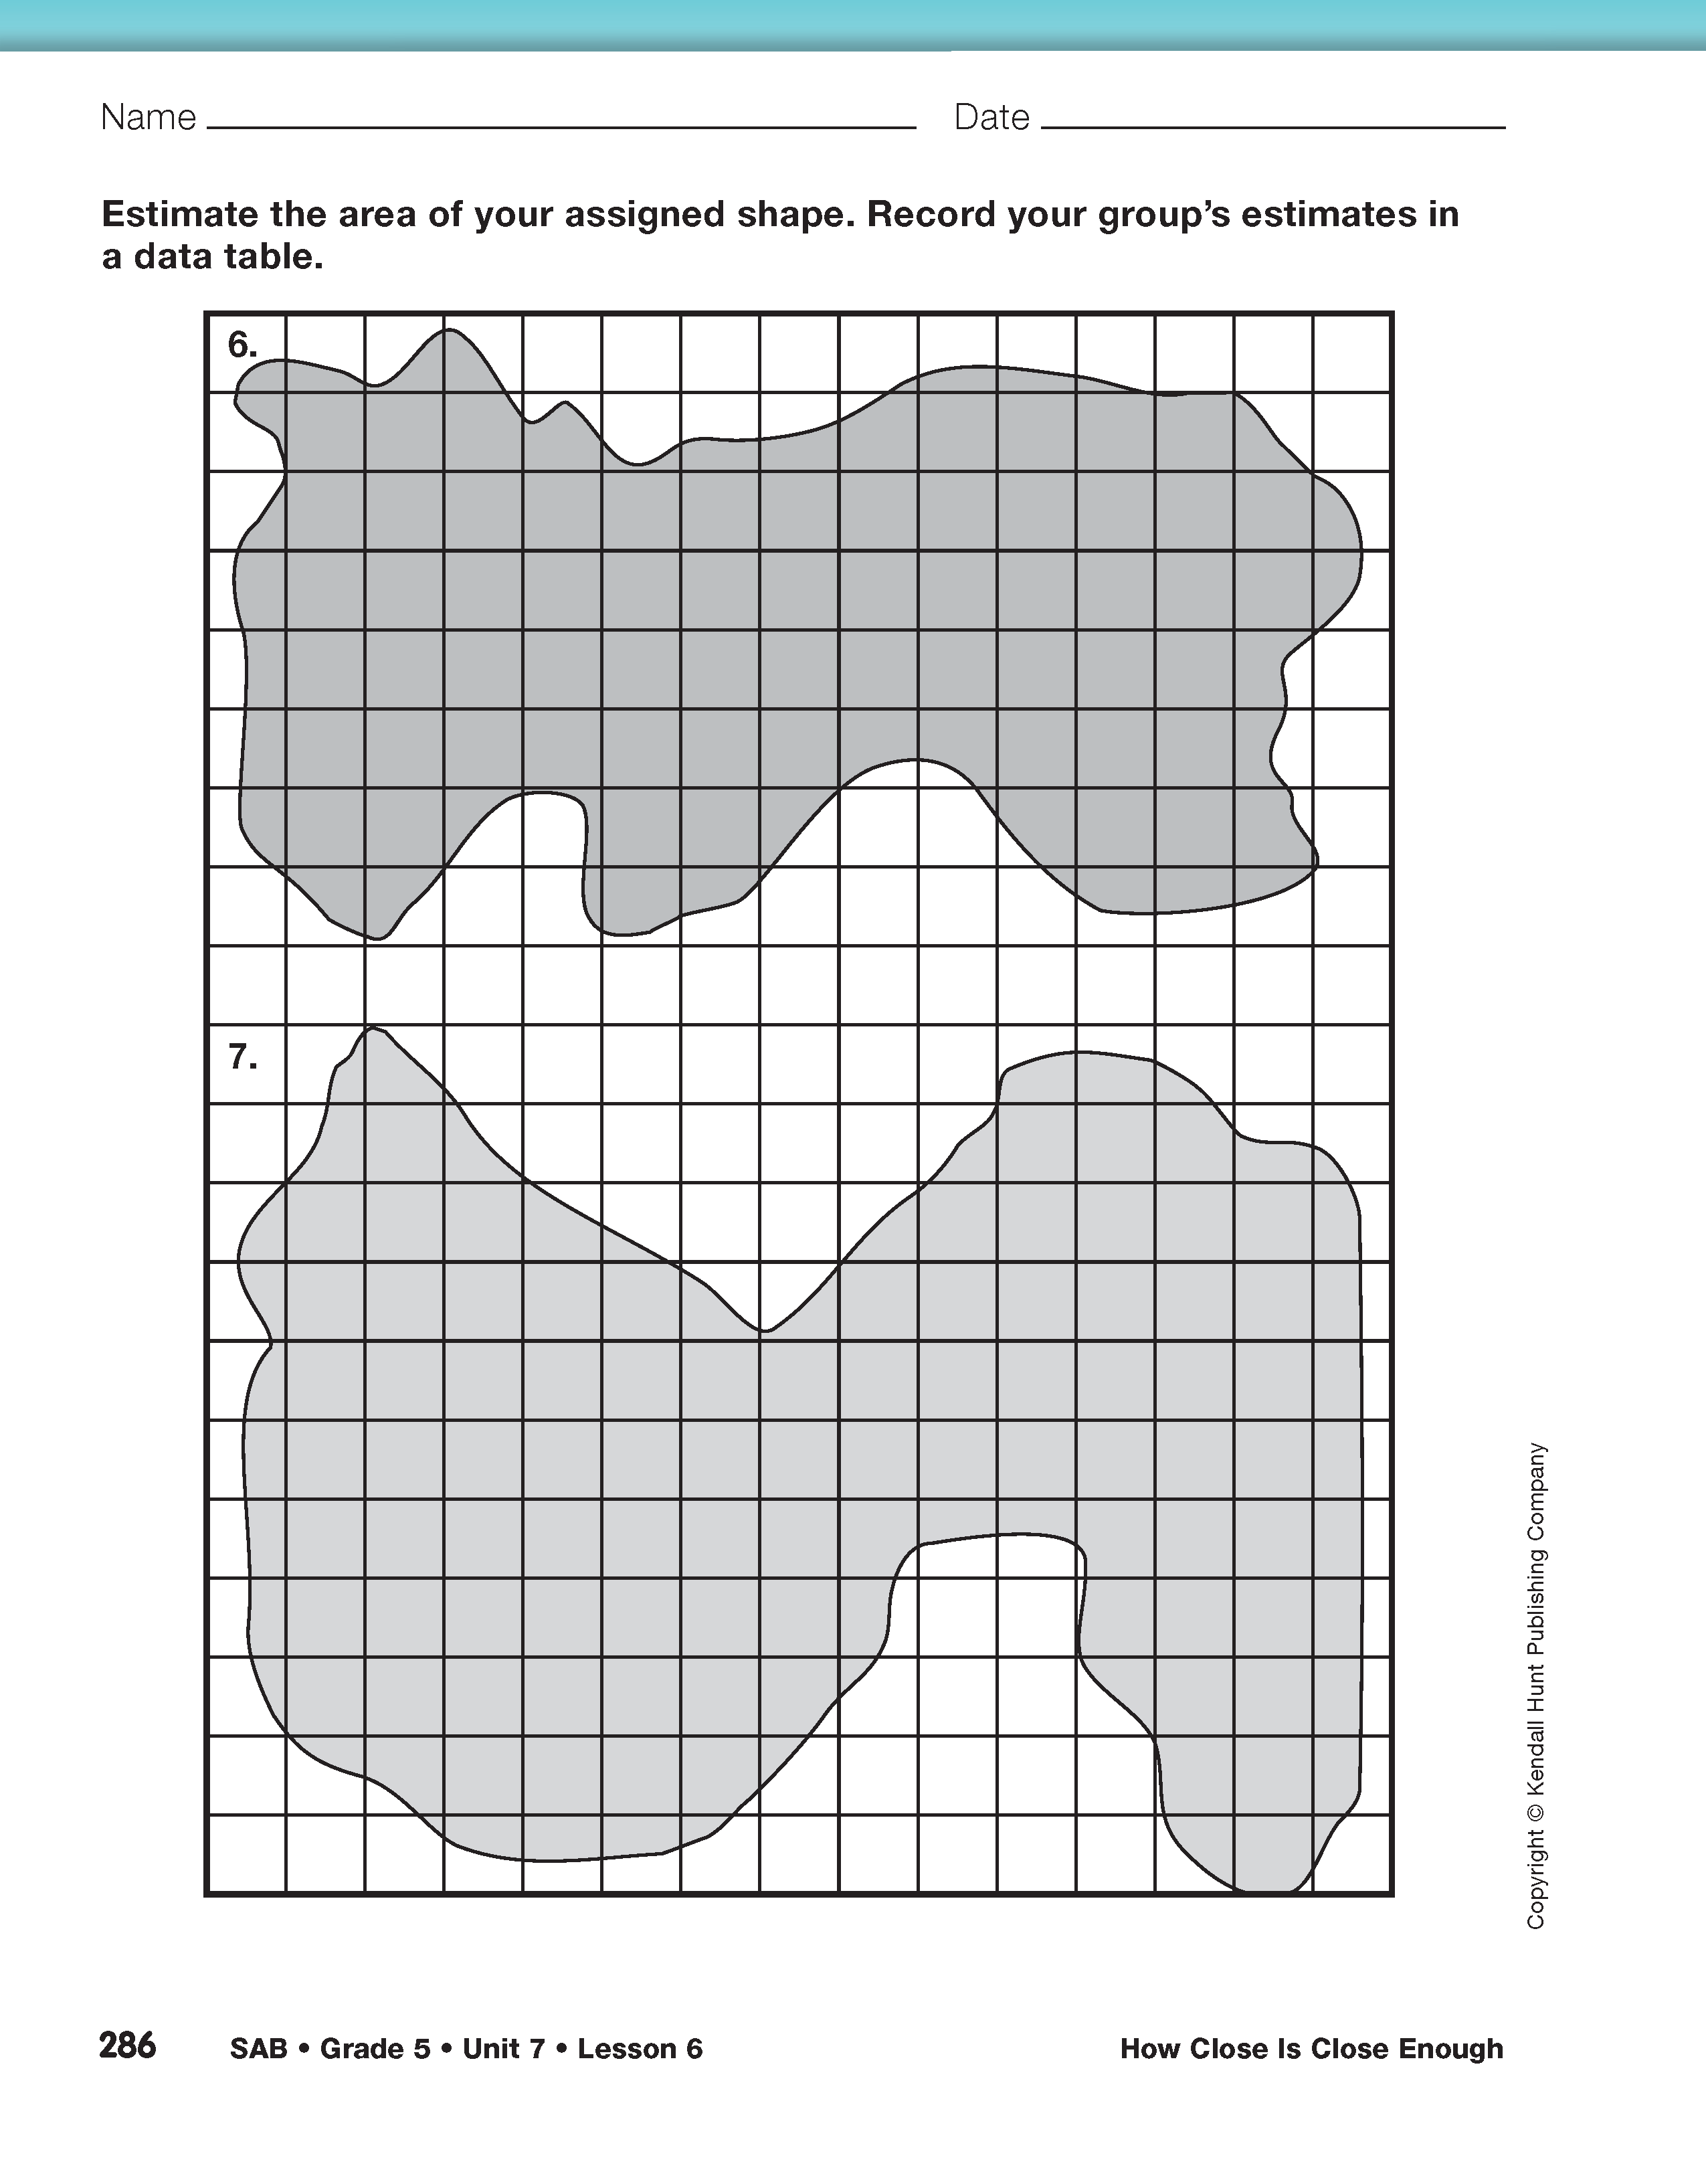
When all groups have finished their data collection, choose one of the larger shapes, either Shape 6 or Shape 7. Ask the groups assigned to that shape to share their estimates. Make a table on the board or on a display of a Two-Column Data Table Master and combine all the estimates into one table. Have students determine the new median.
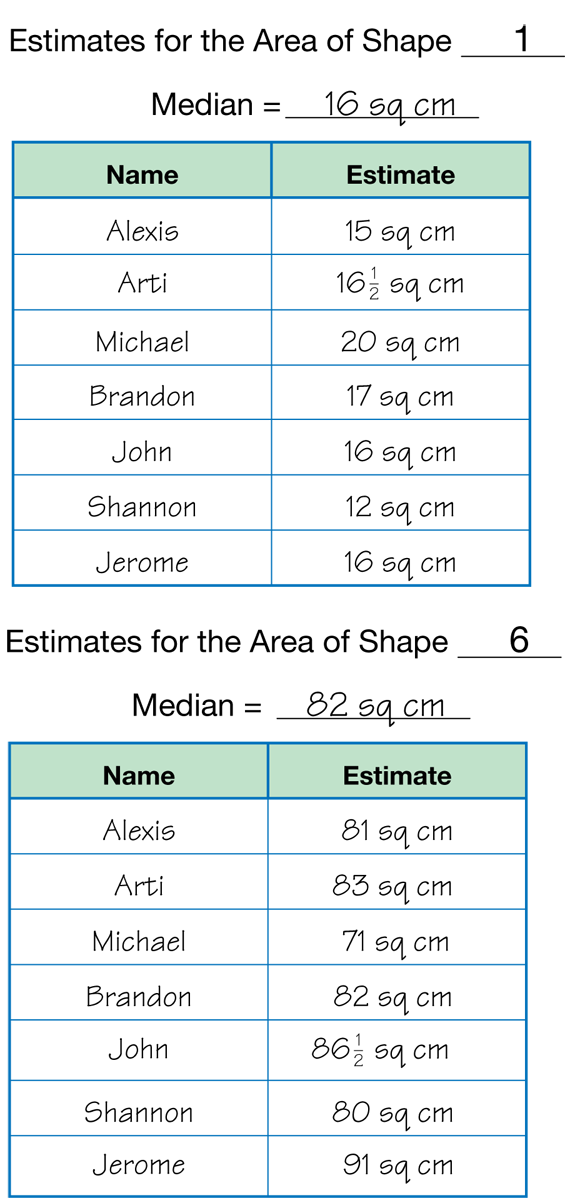
Use a Number Line to Compare Estimates. The following discussion prompts use the estimates in the data tables in Figure 2 as examples. Use the prompts to help guide a discussion on what it means to be “close” using your students' data on one of the shapes. Tell students that the exact area of each of the irregular shapes cannot ever be found. By finding the median estimate, we average out the errors in our measurements. We can usually assume the median is our best estimate of the actual measurement. In this case, using the sample data in Figure 2, the median for Shape 6 is 82 sq cm.
Ask:
Draw a number line or use your classroom number line. Mark or point out where the estimates, including the median, fall on the number line. Figure 3 shows number lines for the sample data for Shapes 1 and 6.
Ask:
The students' estimates likely will cluster around the median. The number line for Shape 6 shows that the data clusters around 82 sq cm.
Ask:
Let students choose a range of values that makes sense to them. Using sample data on the number line in Figure 3, students may say that close estimates are the ones closest to the median of 82 sq cm, or from 80 to 83 sq cm. Others may want to include the point at 87 sq cm. Students will likely not name estimates that lie as far away as 91 and 71 sq cm as good estimates. They may say that the estimates must be within 5 square centimeters to be close. For example, if the median estimate for the area is 82 sq cm, then students may choose to accept estimates in the range of 77 to 87 sq cm. Any reasonable range will do for now.
Now do the same with the estimates for a small shape such as Shape 1. List all the estimates made for this shape and have students find the median. Put the estimates on a number line.
Ask:

Compare Median Estimates for Large and Small Irregular Shapes. At first, students may choose the same range of values as they did for the larger shape. For example, if the median estimate for Shape 1 is 16 sq cm, students may say that good estimates may also be within 5 sq cm of the median estimate. However, other students may feel that estimates as low as 11 sq cm and as high as 21 sq cm are not good estimates for Shape 1.
Ask students to think back to the reasonable range for the estimates of the area of the large shape.
Students should begin to see that the larger the shape, the larger the range of acceptable estimates, and the smaller the shape, the smaller the range of acceptable values. It is clear that we cannot use a difference of 5 sq cm as our standard for both Shapes 1 and 6. Estimates within 5 sq cm of 82 sq cm for Shape 6, such as 77– 87 sq cm, can be considered good estimates. However, using the same standard for acceptable estimates for the number of sq cm in Shape 1 is not appropriate.
Ask: