Spreading Out
Est. Class Sessions: 4–5Developing the Lesson
Part 2. Collect and Record Data
Organize for Data Collection. Before students begin their data collection they will need to make decisions about how to collect and record their data. Ask students to use Question 6 to help guide their thinking.
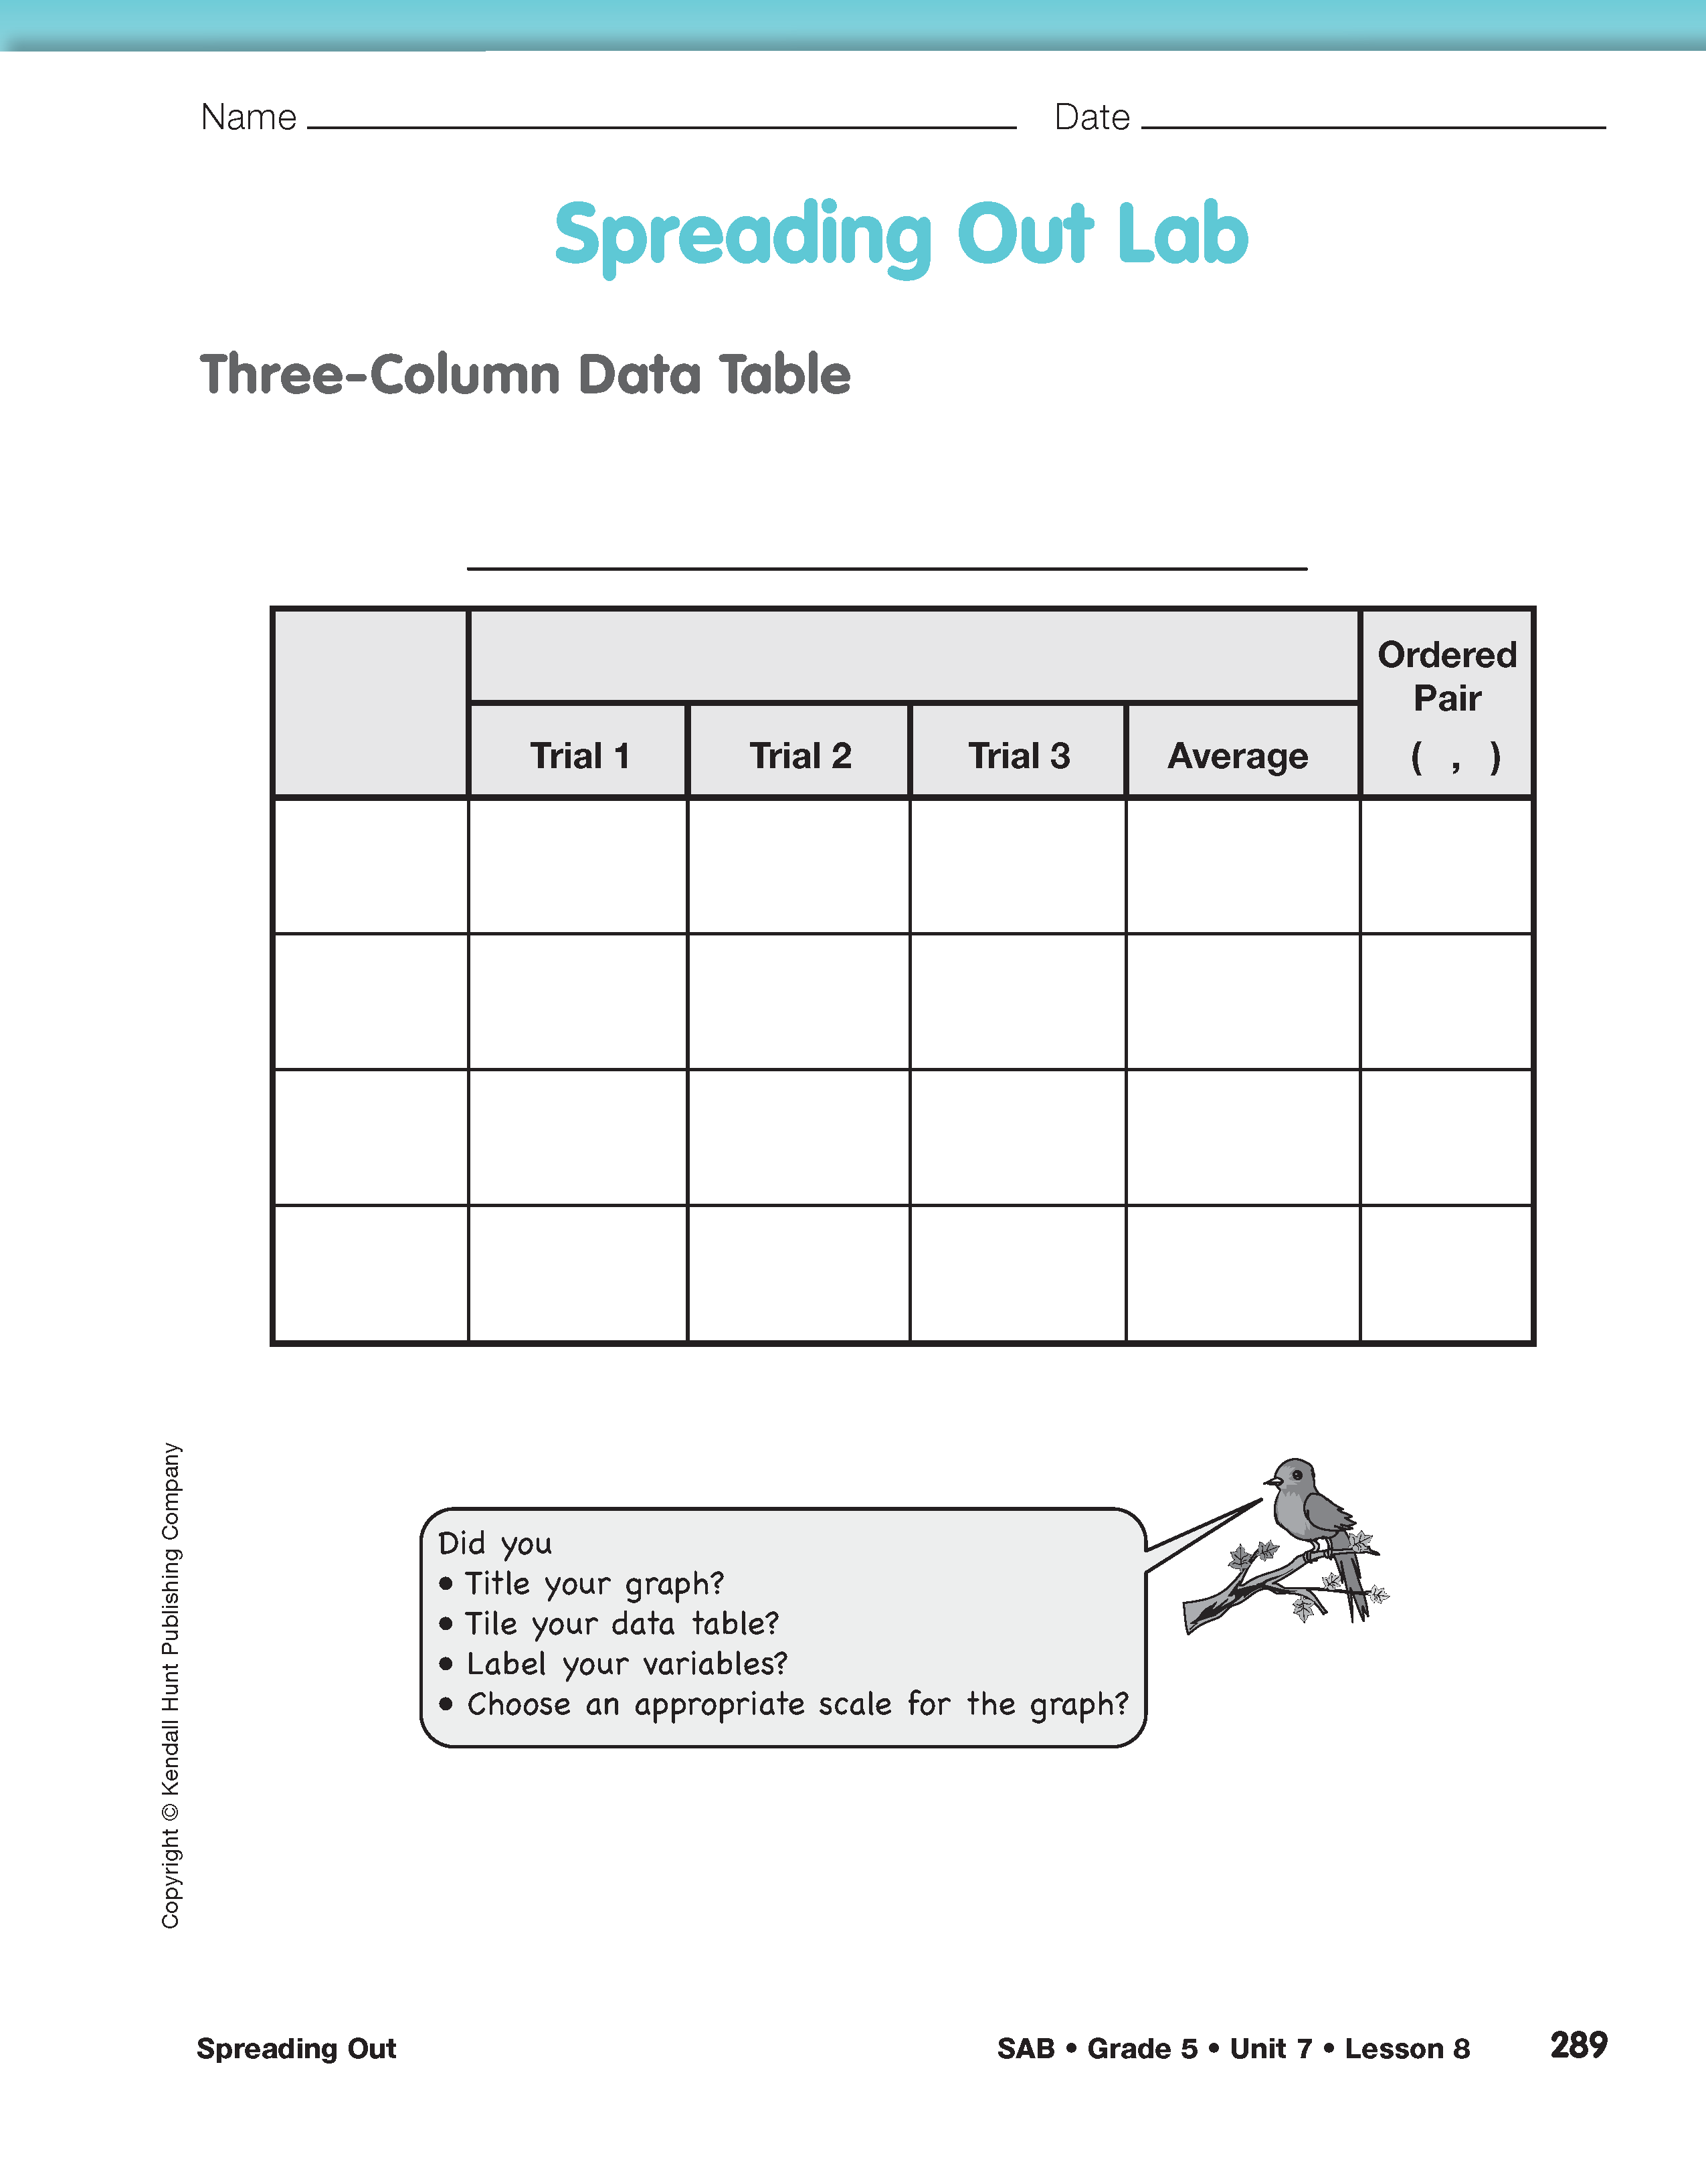
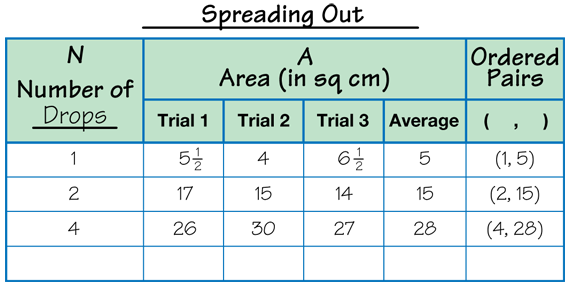
Students are asked to consider the number of trials they will need to make and how they will organize their data in Questions 6A–B. To provide further structure, refer them to the Spreading Out Lab page in the Student Activity Book. Figure 5 shows sample data for the investigation.
Students decide what unit they will use to measure the area of each spot in Question 6C. Students practiced using Centimeter Grid Paper to estimate the area of irregular shapes in Lesson 6 How Close is Close Enough.
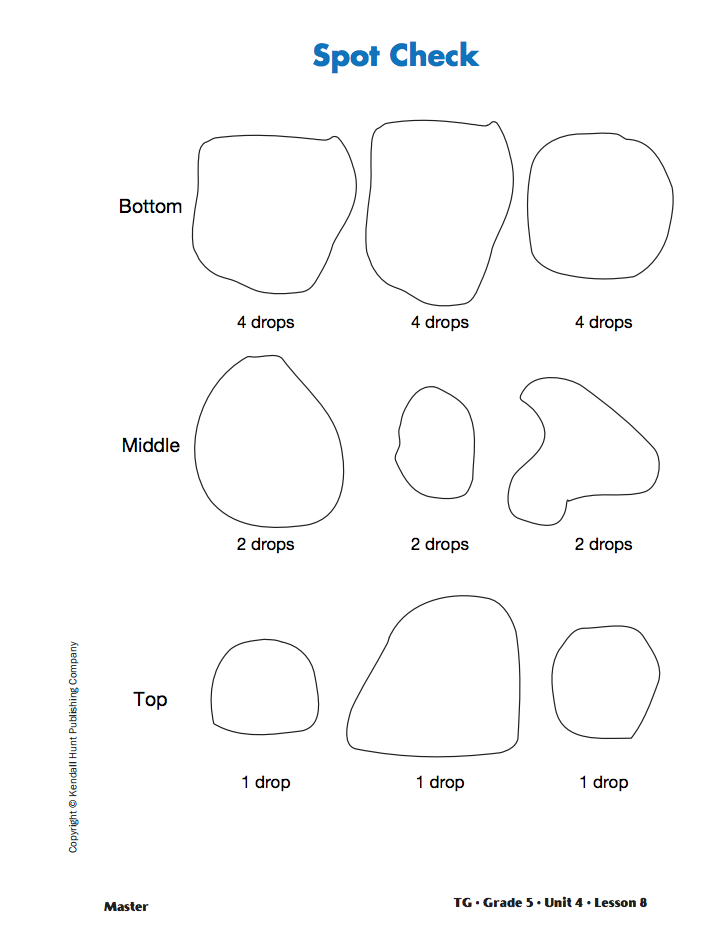
In Question 6D–E students consider how they can check for mistakes in dropping the water to make spots and how they can check to make sure the data they collect is reasonable. Use a display of the Spot Check Master to help students check for obvious errors. The display shows three spots made by a fifth-grade student for one, two, and four drops of water.
As students study the display, ask:
Collect Data. Direct student groups to collect and record their data, after discussing Questions 6A–E. As students are working, observe the strategies they use to estimate the area of each spot. Encourage partners or group members to check each other's work for reasonableness.
After students have collected and recorded their data, they decide whether to use the mean or the median to average their data in Question 7. The data in the table in Figure 5 shows the mean values rounded to the nearest whole centimeter. Since the mean and median for this data are nearly the same, either average can be used to represent the data. If students use the mean, encourage them to use their calculators and to round to the nearest whole centimeter.


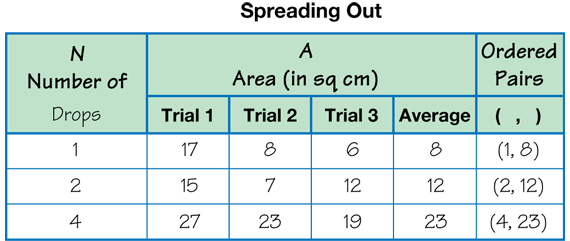
If the range between the data points is large as in the data in the table in Figure 6, students may need to make other choices. For example, of the three measurements for the area of spots made with 1 drop, 17 sq cm is more than twice either of the other two measurements. Similarly, the data for spots made with 2 drops include a data point that is a little more than half of the other two.

In cases like this, students will need to make informed decisions about using their data. The preferred option is to take more trials. However, it may not be practical to get out the equipment and collect more data. Students can also choose to throw out the data points which are significantly different from the others and average the remaining two measurements. As a third option, students can choose to use the median to represent the data instead of the mean, since the median is not as affected by extreme values. Figure 6 shows the medians for the data in the table.
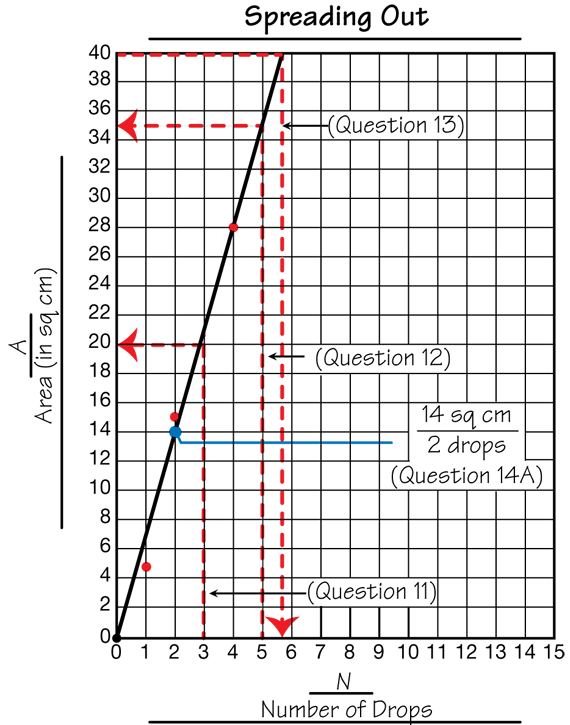
Graph the Data. In Question 8 students graph the data. Remind students to make a point graph of the data. Discuss the reasons for using points instead of bars. Students should add a point at (0 drops, 0 sq cm) to the graph since zero drops will produce a spot with zero area. Then they uses a ruler to fit a line to all four points on the graph as directed in Question 9. A sample student graph of the data in Figure 5 is shown in Figure 7.