Mean or Median
Est. Class Sessions: 2–3Developing the Lesson
Part 1. Another Average: The Mean
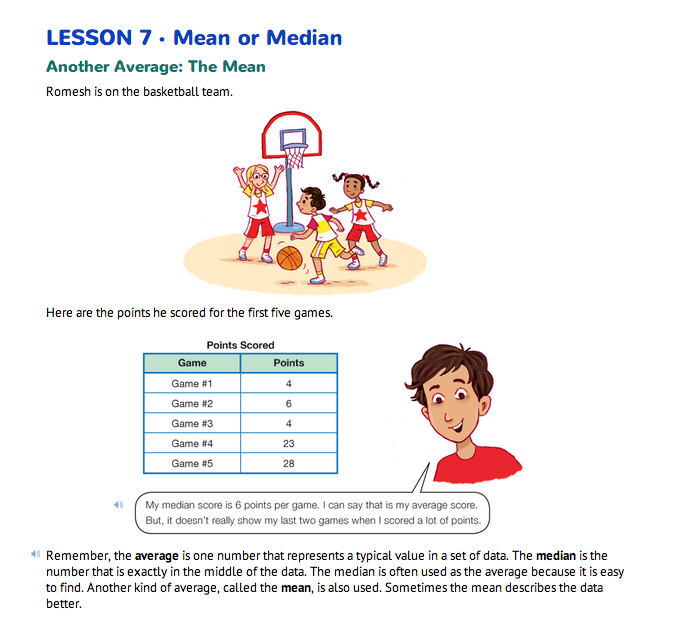
Find the Mean. Use the Mean or Median pages in the Student Guide to lead the discussion. The activity begins with Romesh finding his average points scored during 5 basketball games.
Ask:
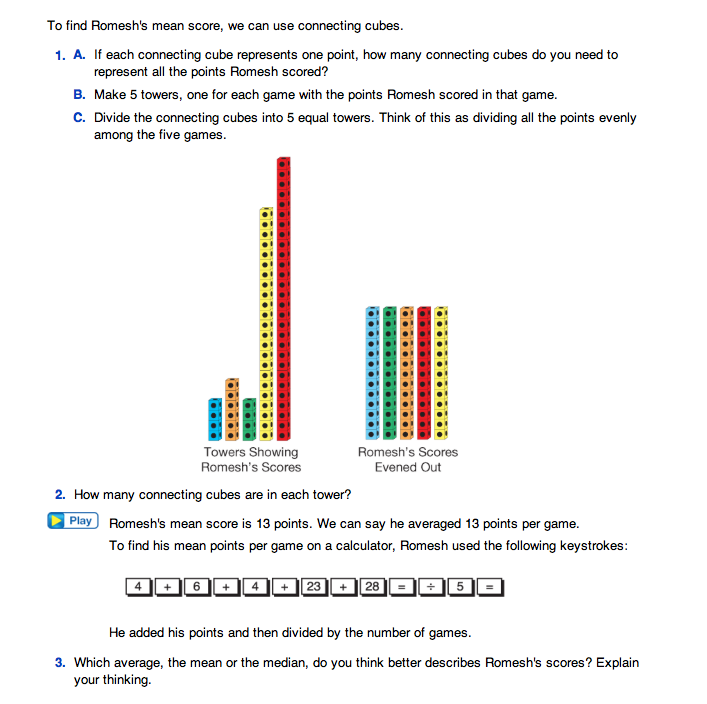
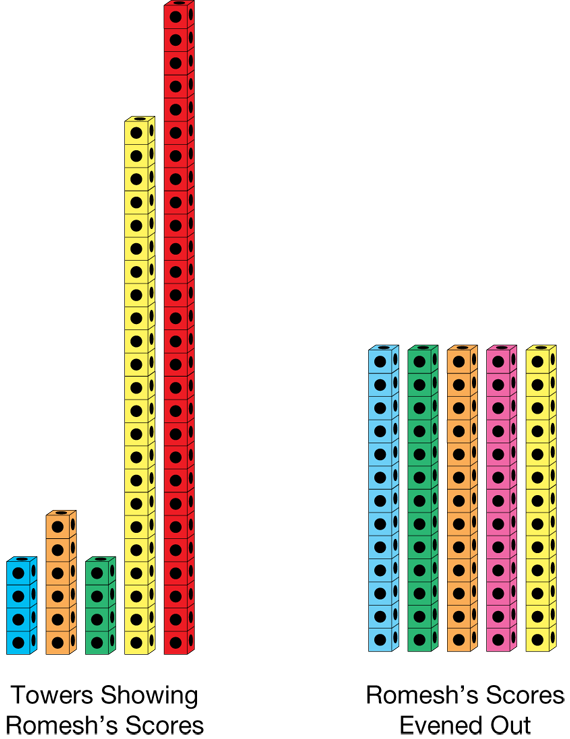
Introduce the mean as another type of average. Remind students that an average is one number that represents a typical value in a set of numbers. To complete Question 1A have students count out enough connecting cubes to represent the total number of points Romesh scored during the 5 games (65). Question 1B then asks students to begin with the 5 towers that represent Romesh's scores (towers of 4, 6, 4, 23, and 28 cubes). Check to see that students can connect the cubes to the situation they represent.
Ask:
In Question 1C students then even out the cubes.
Explain to students that they are evening out the points. They are looking for one number to represent all of Romesh's scores. The number of cubes in each tower, when the towers are the same height is the mean.
In Question 2, students should find that each tower contains 13 cubes as shown in Figure 1. Thus, Romesh's mean score is 13 points per game.
Question 3 asks students to identify which number, the mean or the median, better represents Romesh's scores. The mean better reflects Romesh's efforts because while there are 3 scores well below 13, there are 2 scores well above 13.
Students should compute the mean using their calculators. Note that it is important to press ( ) before dividing. Otherwise, the calculator may divide the last number entered, not the sum of the numbers. Show students how to avoid reentering all the data when they make a mistake. On many scientific calculators, a delete key (
 ) or back arrow key (
 ) allows correction of entered keystrokes. Advise students to follow the directions for their calculators.
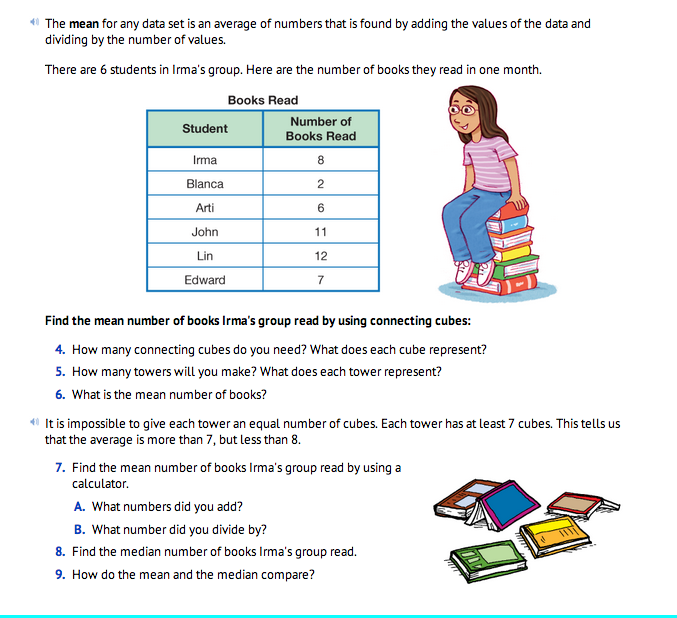
In Questions 4–9, students explore an example where the mean is not a whole number. When using the cubes, we can say that the average is over 7, but less than 8. In Question 7, students find the mean to be 7.7 (to the nearest tenth) on their calculators. Since there is an even number of values, the median (7.5) is the value halfway between the two middle values (Question 8). Students should see in Question 9 that in this example, the mean and the median are very close. This often happens when the data are not very spread out.
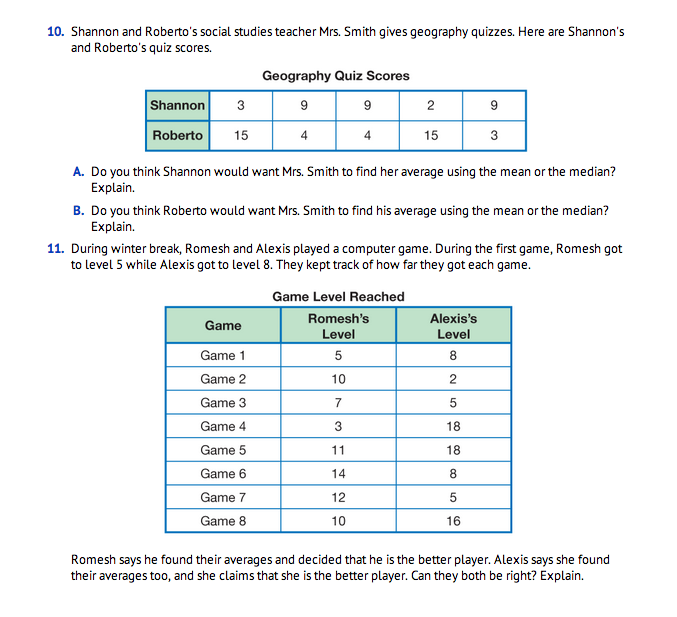
Advantages and Disadvantages of Using the Mean or Median. Questions 10–13 introduce the idea that use of different kinds of averages sometimes results in different interpretations and that people sometimes choose which to use, the mean or the median, to their advantage.
For example, in Question 10, while Shannon's mean score is between 6 and 7, her median score is 9. On the other hand, Roberto's mean is a little more than 8 and his median is 4. Thus, Shannon would like the teacher to use the median, while Roberto would like the teacher to use the mean.
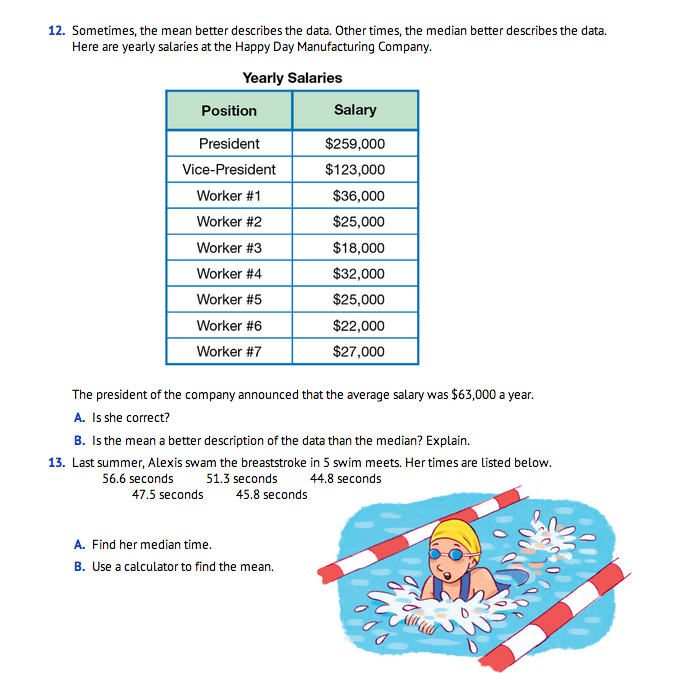
Question 12 brings up the important idea that it is sometimes the mean and sometimes the median that better describes the data. Since most employees earn a salary in the 20–30 thousand dollar range, the median is more appropriate. The outliers (the president and the vice-president salaries) raise the mean value so much that it does not fairly represent the salaries of most employees.
Question 13 asks students to compute a mean involving decimal data. Allow students to use calculators and discuss whether they think the mean should be rounded or left as is. Since the times were reported with 1 decimal place, it is appropriate to leave the answer as 49.2 seconds.
Homework Questions 1–6 on the Mean or Median pages in the Student Guide can be assigned at the end of Part 1 of the Lesson.


