Spreading Out
Est. Class Sessions: 4–5Developing the Lesson
Part 3. Explore the Data
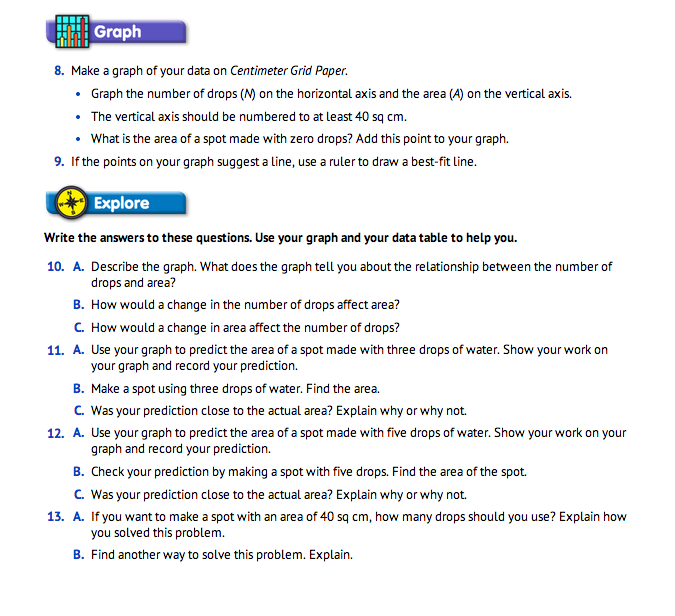
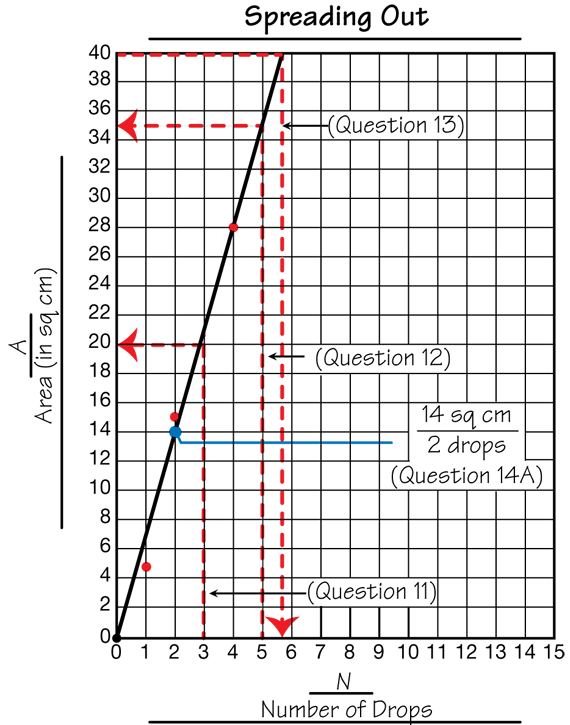
Use Data Tables and Graphs. Use Questions 10–15 to explore the results of the experiment Question 10 asks students to describe the graph by considering what will happen to one variable given a change in a second variable. This is an important algebraic idea. Questions 11–13 provide opportunities for students to use their graphs and data tables to solve problems and check their own work in the laberatory setting. Using their best-fit lines, students predict the area of spots made with three drops and five drops of water. For example, using the best-fit line on the sample graph, a reasonable prediction for the area of a spot made with three drops is 21 sq cm. Notice how this is shown on the graph in Figure 7. Students can check their predictions by making spots with three drops of water and counting the areas. If students find their predictions are not close, they can go back and look for errors in dropping water to make spots, counting square centimeters, and drawing a best-fit line.
Question 13 asks students to find the number of drops needed to make a spot with an area of 40 sq cm using two different strategies. This problem can be solved using a graph if the vertical axis is scaled to include 40 sq cm. (See Figure 7.) Using the data from the graph, about 6 drops will make a spot with an area of about 40 sq cm. Students can check their predictions by making spots with 6 drops of water and finding the areas. Other strategies are possible. For example, if a three-drop spot makes a spot with an area of 21 sq cm, then a 6-drop spot will have an area of a little more than 40 sq cm.
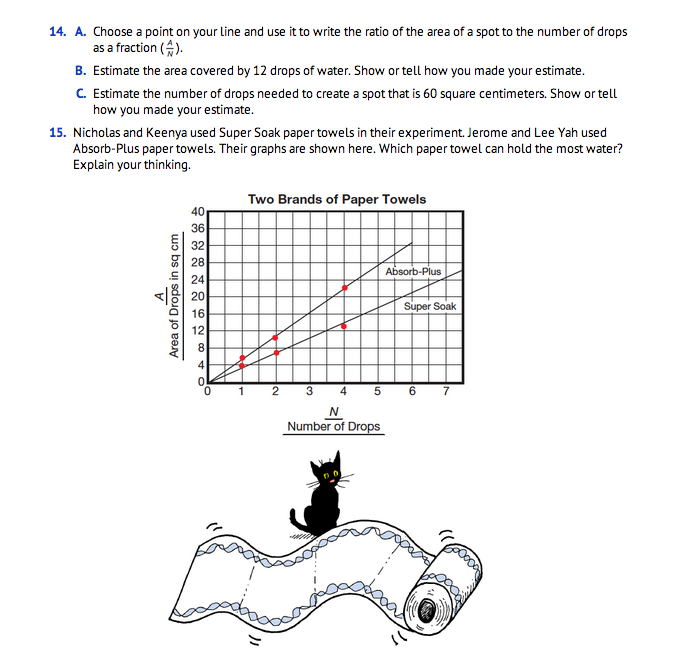
Use Ratios. To answer Question 14, students must combine their knowledge of area, ratios, and graphs. To answer Question 14A, a student must select a point on his or her best-fit line and use it to write the ratio (A/N) of the area of a spot to the number of drops. Encourage students to use points where the line crosses grid lines. Using the graph in Figure 7, we can write A/N = 14 sq cm/2 drops. Question 14B asks students to estimate the area covered by 12 drops. Students can use equivalent fractions to solve the problem:

Solutions will vary based on differences in data. Other strategies are also possible. Encourage students to discuss their answers and give reasons for the differences.
Question 14C asks students to estimate the number of drops needed to create a spot that is 60 square centimeters. Students can use equivalent fractions to solve the problem:

Solutions will vary based on differences in data.
Students must analyze the graph in Figure 8 to answer Question 15. Students should conclude that Super Soak paper towels are the most absorbent because each drop covers less area, so the towel can soak up more drops in a smaller area.