Define the Manipulated and Responding Variables. Direct students to the Spreading Out pages in the Student Guide. The vignette at the beginning of these pages sets the context for this investigation. Read the first part of this vignette as a class or ask students to read these pages in small groups.
After reading the introduction, ask:
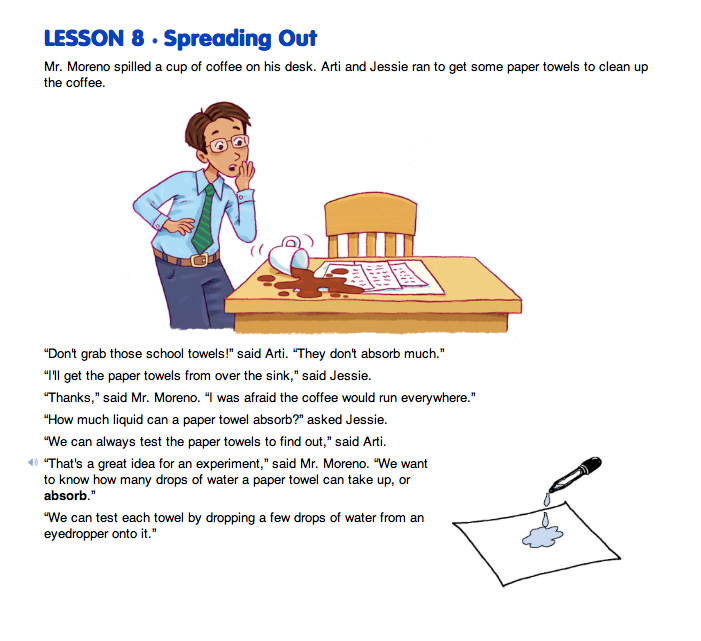
- What do Arti and Jessie want to find out about paper towels? (Possible response: They want to find out how many drops of water a paper towel can absorb.)
- Jessie wants to count the number of water drops it would take to fill the whole towel. Why did Arti think that might not work? (Arti thought it would be too easy to lose count of the drops.)
- What strategy does Mr. Moreno suggest? (Possible response: He suggests they make smaller spots and then after finding the area of the smaller spot use that information to find the number of drops a whole towel will hold.)
The Identifying Variables section uses the terms manipulated and responding variables for the first time in Fifth Grade. The manipulated variable is the number (N) of drops used, since Arti and Jessie chose the values before they began collecting data. The responding variable is the area (A) of the spots since they find the values for area by doing the investigation.
After reading this section, ask:
- What are the two variables Arti and Jessie identified for their investigation? (number of drops of water, and area of the spot)
- Which variable is the manipulated variable? (number of drops of water) How did you decide? (Possible response: It is the variable for which we could decide the values in advance.)
- Why is the area of the spot the responding variable? (Possible response: Because the value of the this variable depends on the number of spots we drop. We don't know it in advance.)
- Think about the investigation Searching the Forest that we did in Unit 1. What were the two main variables? (color and number)
- Which one was the manipulated variable? That is, for which variable did you know the values before you began collecting data? (color)
- Which variable was the responding variable? That is, for which variable did you find the values by collecting the data? (number)
Decide Which Type of Graph. In the next section of the vignette, Bar Graph or Point Graph, Arti and Jessie need to think about the variables they have identified and then decide whether it is more appropriate to use a point graph or a bar graph to record their data. Before reading this section display the Bar Graph or Point Graph Master. Use this display and the suggested discussion prompt to helps student connect these concepts to labs in previous units.
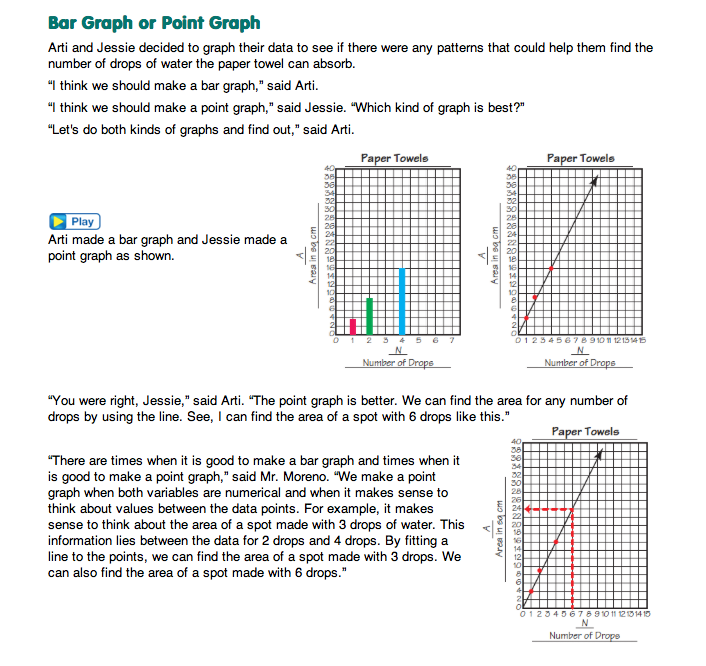
Figure 1 shows a bar graph from Searching the Forest and a point graph from Distance vs. Time.

Manipulated, Responding, and Fixed Variables. In simple experiments, students look for the relationship between two main variables. We call these two variables the manipulated variable and the responding variable. These variables are also commonly called the independent and dependent variables. After many years of working with students on identification of variables, we have found the terms manipulated and responding to be less confusing than independent and dependent. However, the important idea is for students to understand that as we change the values for the manipulated variable, we look for a corresponding change (a response) in the values of the responding variable.
The idea of controlled, or fixed, variables in an investigation is also very important. In this lab, there are several variables that need to remain fixed: the type of paper towel, the type of liquid, the eyedropper, how the water is dropped on the paper towel. Some variables need to remain fixed so students can determine the number of drops in a sheet of paper towel with some certainty. If the drop size varied widely, measurements could not be compared.
- Look at the two graphs on the display. We used a bar graph to represent the data in the Searching the Forest Lab. In this lab are there any data points that fall between the bars? (no) How do know? (Possible response: Since color is a categorical variable it does not make sense to talk about values between the colors. For example, there is no value or color of square-inch tile between green and blue.)
- Why did a point graph make sense for representing data in the investigation for Distance vs. Time? (Possible response: There are values between each value we choose for time. For example, the graph shows a data point for 3 seconds and one for 6 seconds but there are two other values that are between them: 4 seconds and 5 seconds.)
- How does a point graph help you to make predictions about the data you are collecting? (Possible response: When you draw a best-fit line for the data, you can use that line to make predictions beyond the data you collected.)
- Why did Jessie and Arti finally decide that a point graph was the best graph for representing their data? (Possible response: They decided they could use the best-fit line to find the area of any number of drops and they could also find out the number of drops needed if they knew the area of a spot.)
After reading the vignette, ask students to work with a partner or in a small group to complete the lab. Direct students to Questions 1–4 in the Student Guide and have students read and discuss these questions with their partner or group. In Question 1, students are asked to identify a strategy that Jessie and Arti can use to measure the area of each spot.
If students have difficulty with this question use these or similar discussion prompts to help focus their thinking:
- When are other times that you have measured the area of irregular shapes? (Possible responses: In Lesson 6 we estimated the area of irregular shapes to make sure our answers were reasonable. In Third Grade we measured the area of Boo the Blob; we also measured area to find out how much fabric we would need to make a coat for Joe the Goldfish. In Third Grade we measured the area of spots on paper towels to see which paper towel picked up more water.)
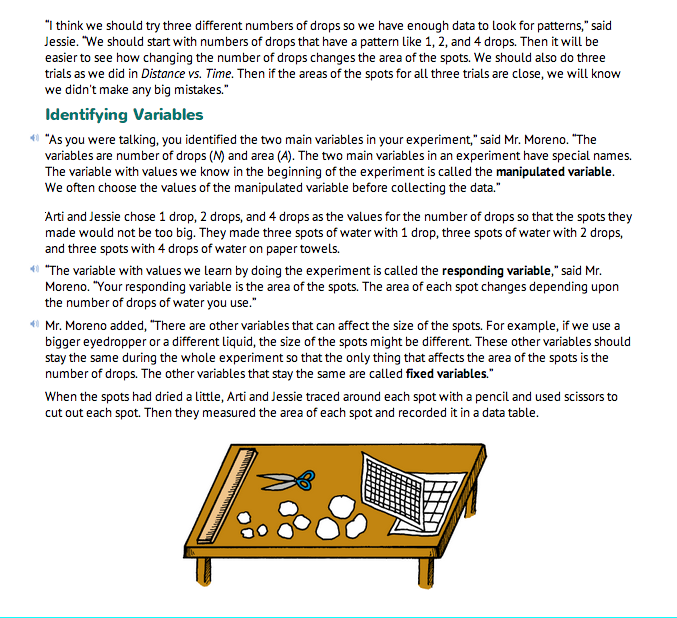
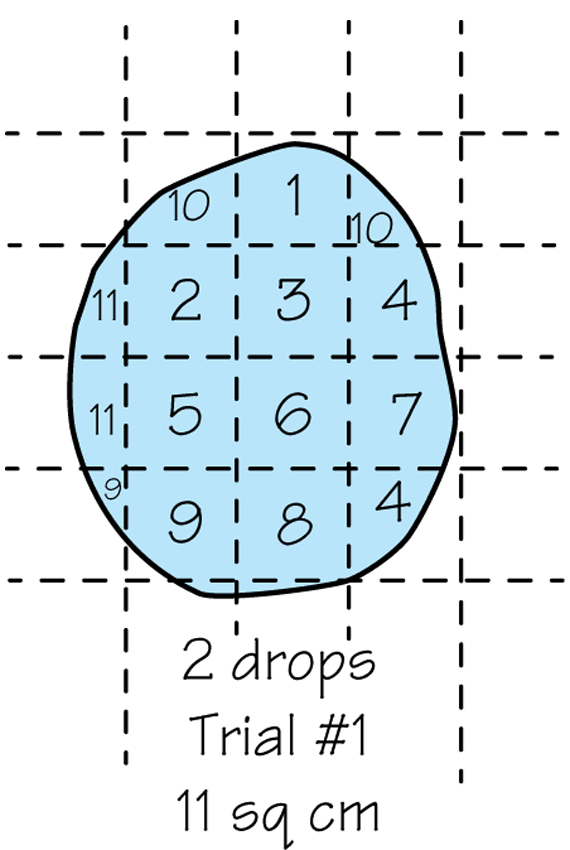
- What tools and strategies were helpful for finding the area of irregular shapes? (Possible response: To find the area of irregular shapes it was helpful to use a grid so you could count the square units.)
- What do you have to think about when you are counting the square units to find the area of an irregular shape? (Possible response: You have to remember to count all of the partial square units and then combine them to estimate whole units.)
Figure 2 shows a strategy for counting the area of a spot.
Students identify the manipulated and responding variables in Question 2. To look for the relationship between these two variables (the number of drops (N) and the area of the spot (A)), there are other variables involved in the experiment that must be kept fixed (Question 3). These include:
- Type of paper towel.
- Type of liquid. (Water is used throughout the experiment.)
- The size of the drop. (To ensure drops of the same size, it is best to use the same eyedropper for all drops.)
- Procedure for making spots. (Drop each drop in the center of the spot you are making. Keep the eyedropper at the same level above the towel for each drop.)
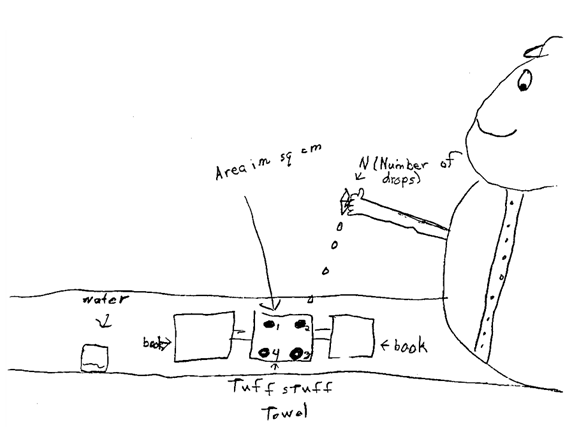
Students should also keep the towel off the desk's surface until their spot has dried enough to cut it out. One way to do this is to place two books on the desk a little closer together than the width of the paper towel. The edges of the paper towel are placed between the pages of each book so that it is lifted above the desk's surface, as in Figure 3.
Question 4 asks why it is a good idea to make more than one trial. A quick response from students is, “We might make a mistake.” In the experiment there are several ways that error is introduced. First, counting square centimeters does not allow us to find the area exactly. Second, it is not always possible to keep all of the fixed variables constant. For instance, using the same eyedropper may not ensure that the spots are all the same size since students often have trouble controlling the bulb of the eyedropper when making spots. Scientists use multiple trials to average out the error that is inevitable in an experiment and to check for large errors. Questions 6D–E ask students to discuss ways to check for large errors.
Draw a Picture. Students begin the experiment using Questions 5–6 on the Spreading Out pages in the Student Guide. They draw a picture of the experimental setup with the main variables labeled Question 5A). The picture allows you to see if students have a clear understanding of the method and variables and are ready to proceed. Figure 4 shows a student's drawing.
As part of designing the experiment, in Question 5B students choose values for the number of drops. Discuss the values that Jessie and Arti chose and decide as a class if these are the ones that you will use also. Students should choose values that are manageable and show a pattern for the relationship of area to the number of drops. Note that Questions 11–12 ask students to interpolate and extrapolate for 3 and 5 drops from their data. Students should not use these numbers of drops in their experiment.