How Close Is Close Enough
Est. Class Sessions: 1–2Developing the Lesson
Part 2. When Are Estimates Close Enough
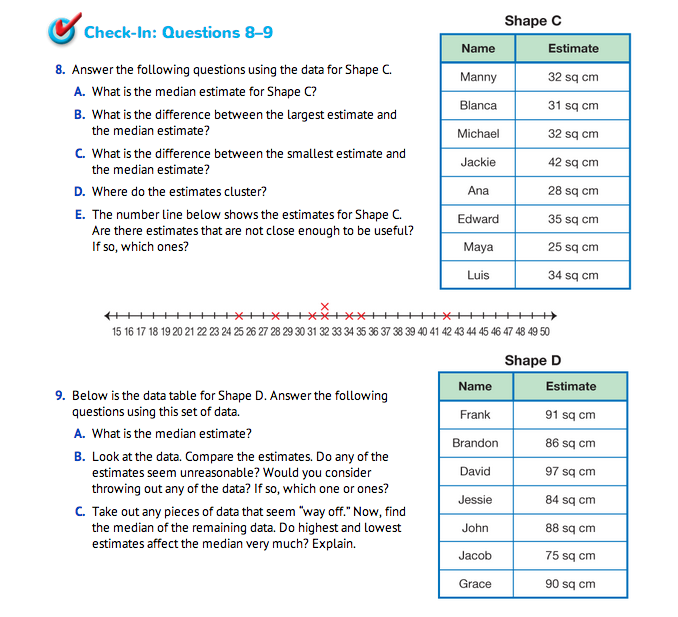
After students have completed the table, they are ready to discuss the questions in the Student Guide. In pairs, students can read the introduction and complete Questions 1–7. Alternatively, you may read the introduction together as a class and discuss Questions 1–7 together. Assign Check-In: Questions 8–9 for students to complete independently. Students analyze the clustering of estimates on the number line and use number sense to determine which estimates might be worth disregarding in finding the median of a data set.
The text and questions in the Student Guide review how to decide which estimates are “close enough.”
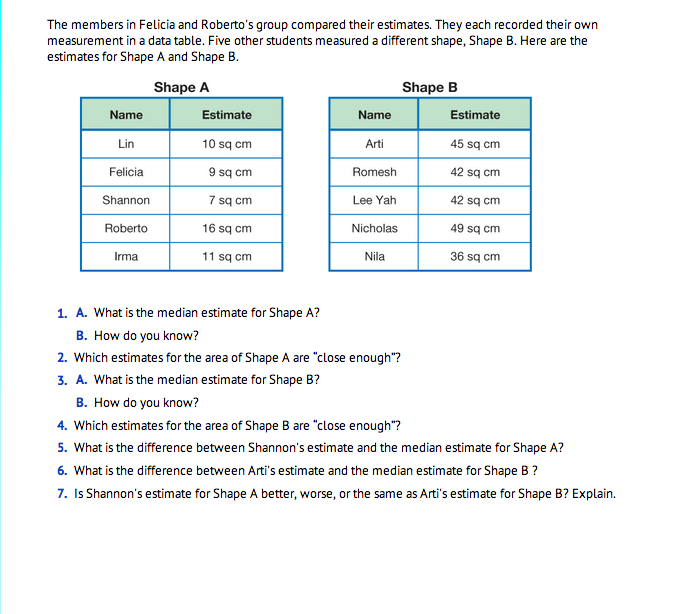
Questions 1–2 ask students to identify the median of the data for Shape A and decide which estimates are close enough.
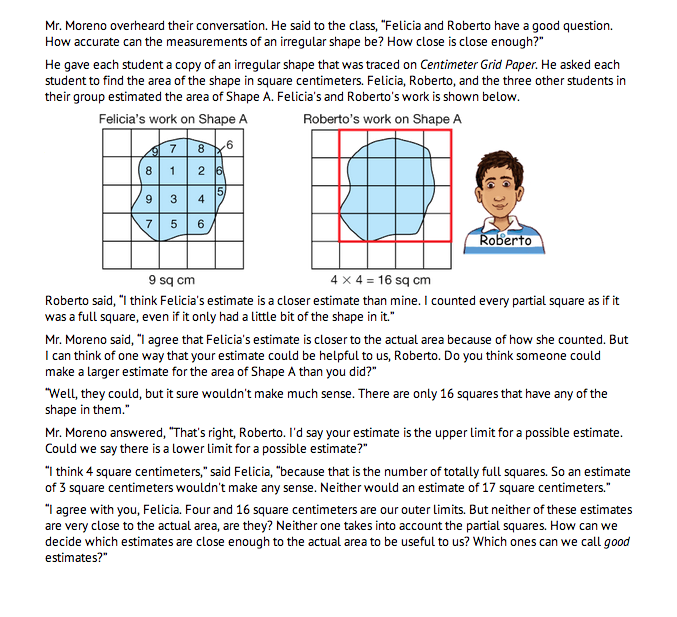
Shape A has a median estimate of 10 sq cm. The vignette in the Student Guide discusses ways to analyze whether an estimate is “close enough” or not. Estimates that are at the extremes may provide a range for analysis but are not close enough to the actual area to be useful.
Felicia's, Lin's, and Irma's estimates of 9 sq cm, 10 sq cm, and 11 sq cm are within a small cluster around the median. However, Shannon's and Roberto's estimates of 7 and 16 sq cm are outside the cluster so students should consider whether their estimates are “close enough.”
Roberto's high estimate of 16 sq cm is not considered a close estimate. Students may have expected this before any calculations were completed. The difference between Roberto's estimate and the median estimate of 10 sq cm is 6 sq cm. This difference makes his data somewhat questionable. Also, in making his estimate he simply enclosed Shape A within a square. The square's area is much greater than Shape A. If you disregard Roberto's estimate because it is an outlier, and find the median of the remaining four pieces of data, instead of all five, the median is 91/2 sq cm instead of 10 sq cm. Both 91/2 sq cm and 10 sq cm represent the data equally well. When using the median, the need to throw out unreasonable pieces of data is not imperative since the median will eliminate the high and low estimates anyway.
Questions 3–4 repeat the process for a larger shape. Before making any calculations, students may have considered the low estimate of 36 sq cm and the high estimate of 49 sq cm as unreasonable estimates. They both seem to be “way off.” If we throw out these two pieces of data and find the median of the remaining three pieces of data, we would find that the median would still be 42 sq cm. Again, using the median eliminates gross errors in the data.
Questions 5–7 review the notion of relative error. When the median estimate for the area of a shape is 42 sq cm, then 45 sq cm is a pretty good estimate. But, when the median estimate for the area of a shape is 10 sq cm, 7 sq cm is not as good an estimate. Although in both cases the difference between the median and the estimate is 3 sq cm, the error should be smaller when the area is smaller.
Question 8 provides more practice identifying estimates that are close enough. Students analyze the clustering of estimates on the number line. Give the class an opportunity to repeat the estimation process using different shapes.