


Birth Months
Est. Class Sessions: 2
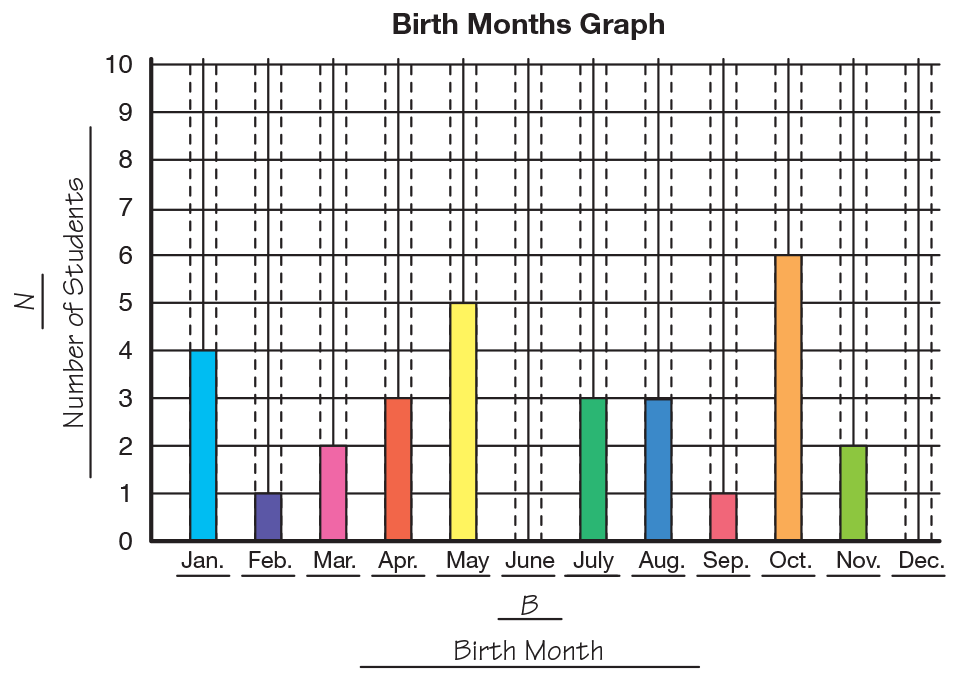
Students review the TIMS Laboratory Method (a four-step adaptation of the scientific method) in a teacher-guided investigation of students' birth months. Students collect and represent this information to solve problems.
Content in this Lesson
- Representing addition and subtraction situations using number sentences [E1].
- Using addition and subtraction to solve one- and two-step word problems involving situations of join, separate/take away, part-whole, and compare [E3].
- Collecting and organizing data in a table.
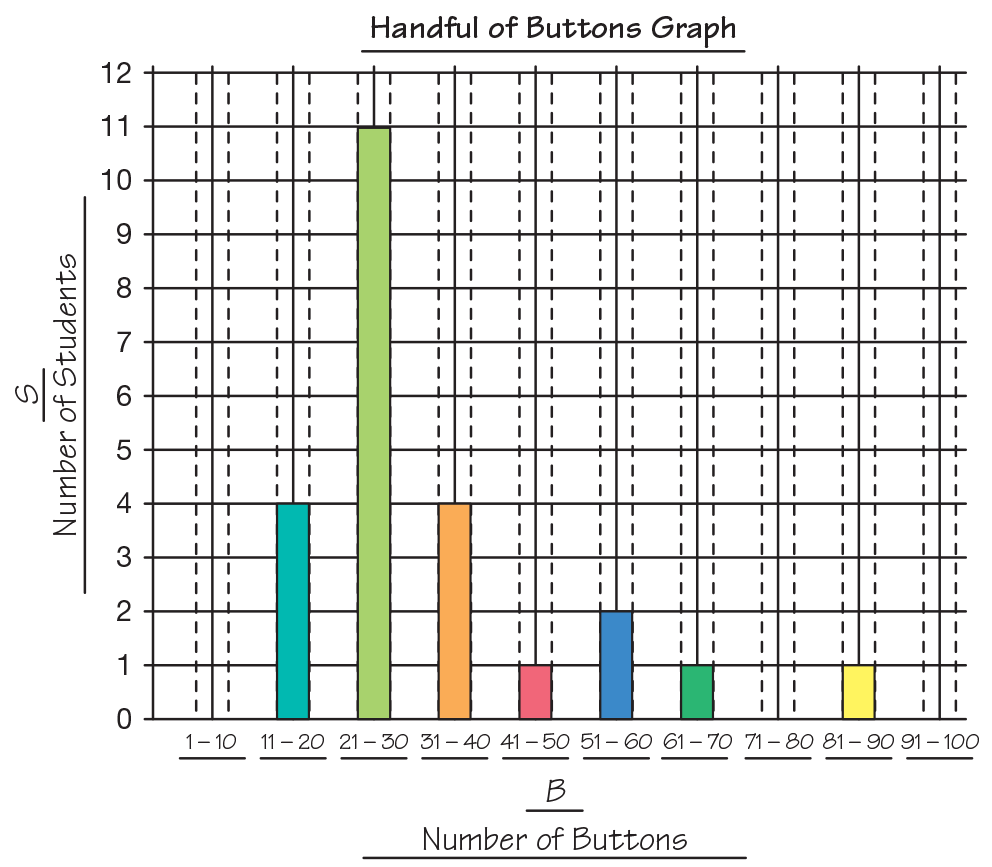
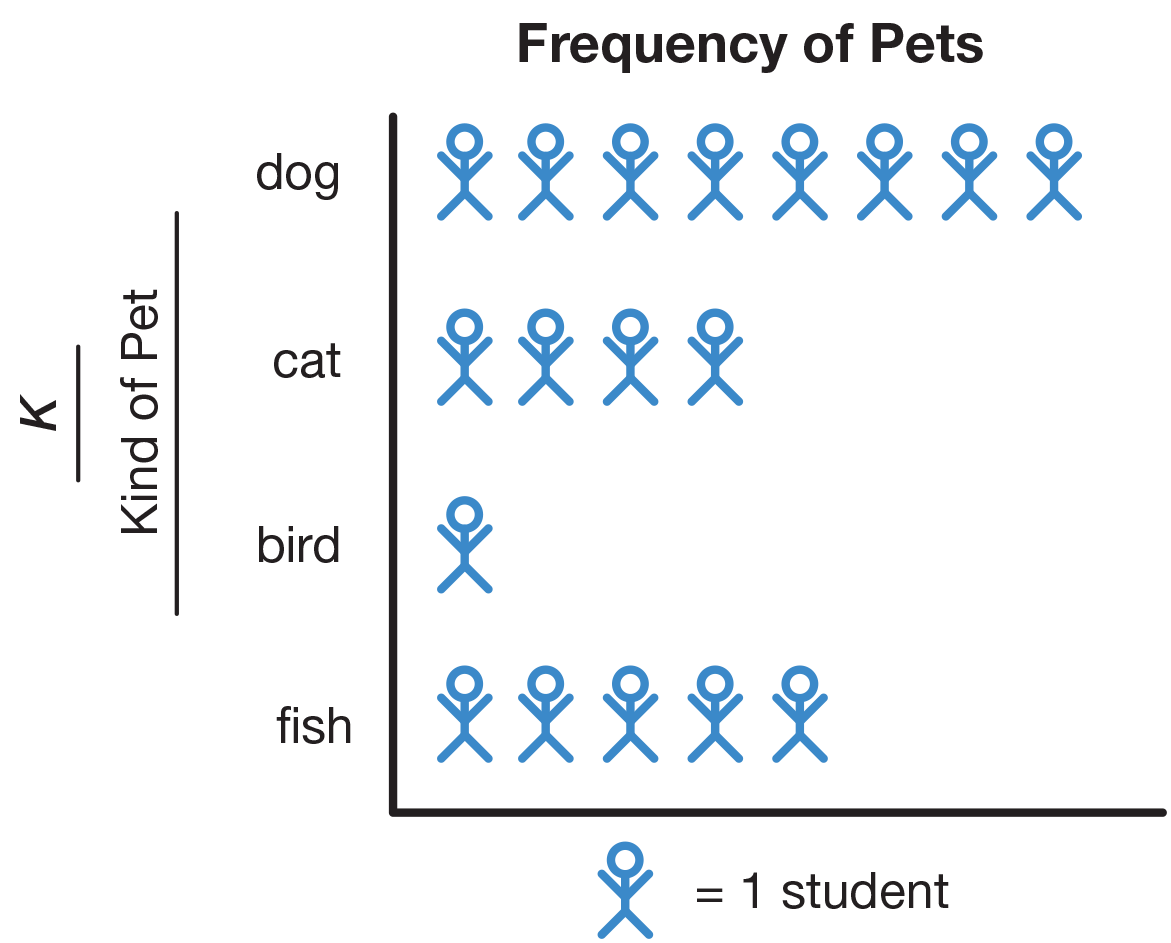
- Making a bar graph and picture graph to find information about a data set.
- Reading a table, bar graph, or picture graph to solve problems about a data set [E6].
- Solving problems using data from a table and graph.
- Showing a strategy [MPE5].
Daily Practice and Problems C–F

Materials for Students
| Daily Practice and Problems | Lesson | Homework | Assessment | ||
|---|---|---|---|---|---|
Student Book |
Student Activity Book |
|
|
|
|
Teacher Resources |
Teacher Guide - digital |
|
Supplies for Students
connecting cubes
desk number line (0–100)
small self-adhesive note
Materials for the Teacher
TIMS Laboratory Method Master (Teacher Guide)
Sample Picture Master (Teacher Guide)
Birth Months Data Table Master (Teacher Guide)
Birth Months Graph Master (Teacher Guide)
Display of the Ten Frames and Number Line Display Master (Teacher Guide), optional
Unit 1 Assessment Record
class number line (0–130) or prepared Number Line Display Masters (Teacher Guide)
chart paper
Materials Preparation
Prepare Birth Months Picture Graph. Make a table on chart paper or the board. See Figure 1. The table should be large enough to fit several small self-adhesive notes across the table to show the number of students who have a birthday in each month. Place a self-adhesive note below the chart as shown in Figure 1.
Prepare Number Line Display. Display a number line where it is easily accessible by both you and the students. Students should be able to see it and touch it with at least a pointer. Use the class number line (0–130) or prepare the Number Line Display Masters. This version can be assembled, laminated, and displayed on the board or on a bulletin board. It is also small enough that it could be moved when it is not needed.
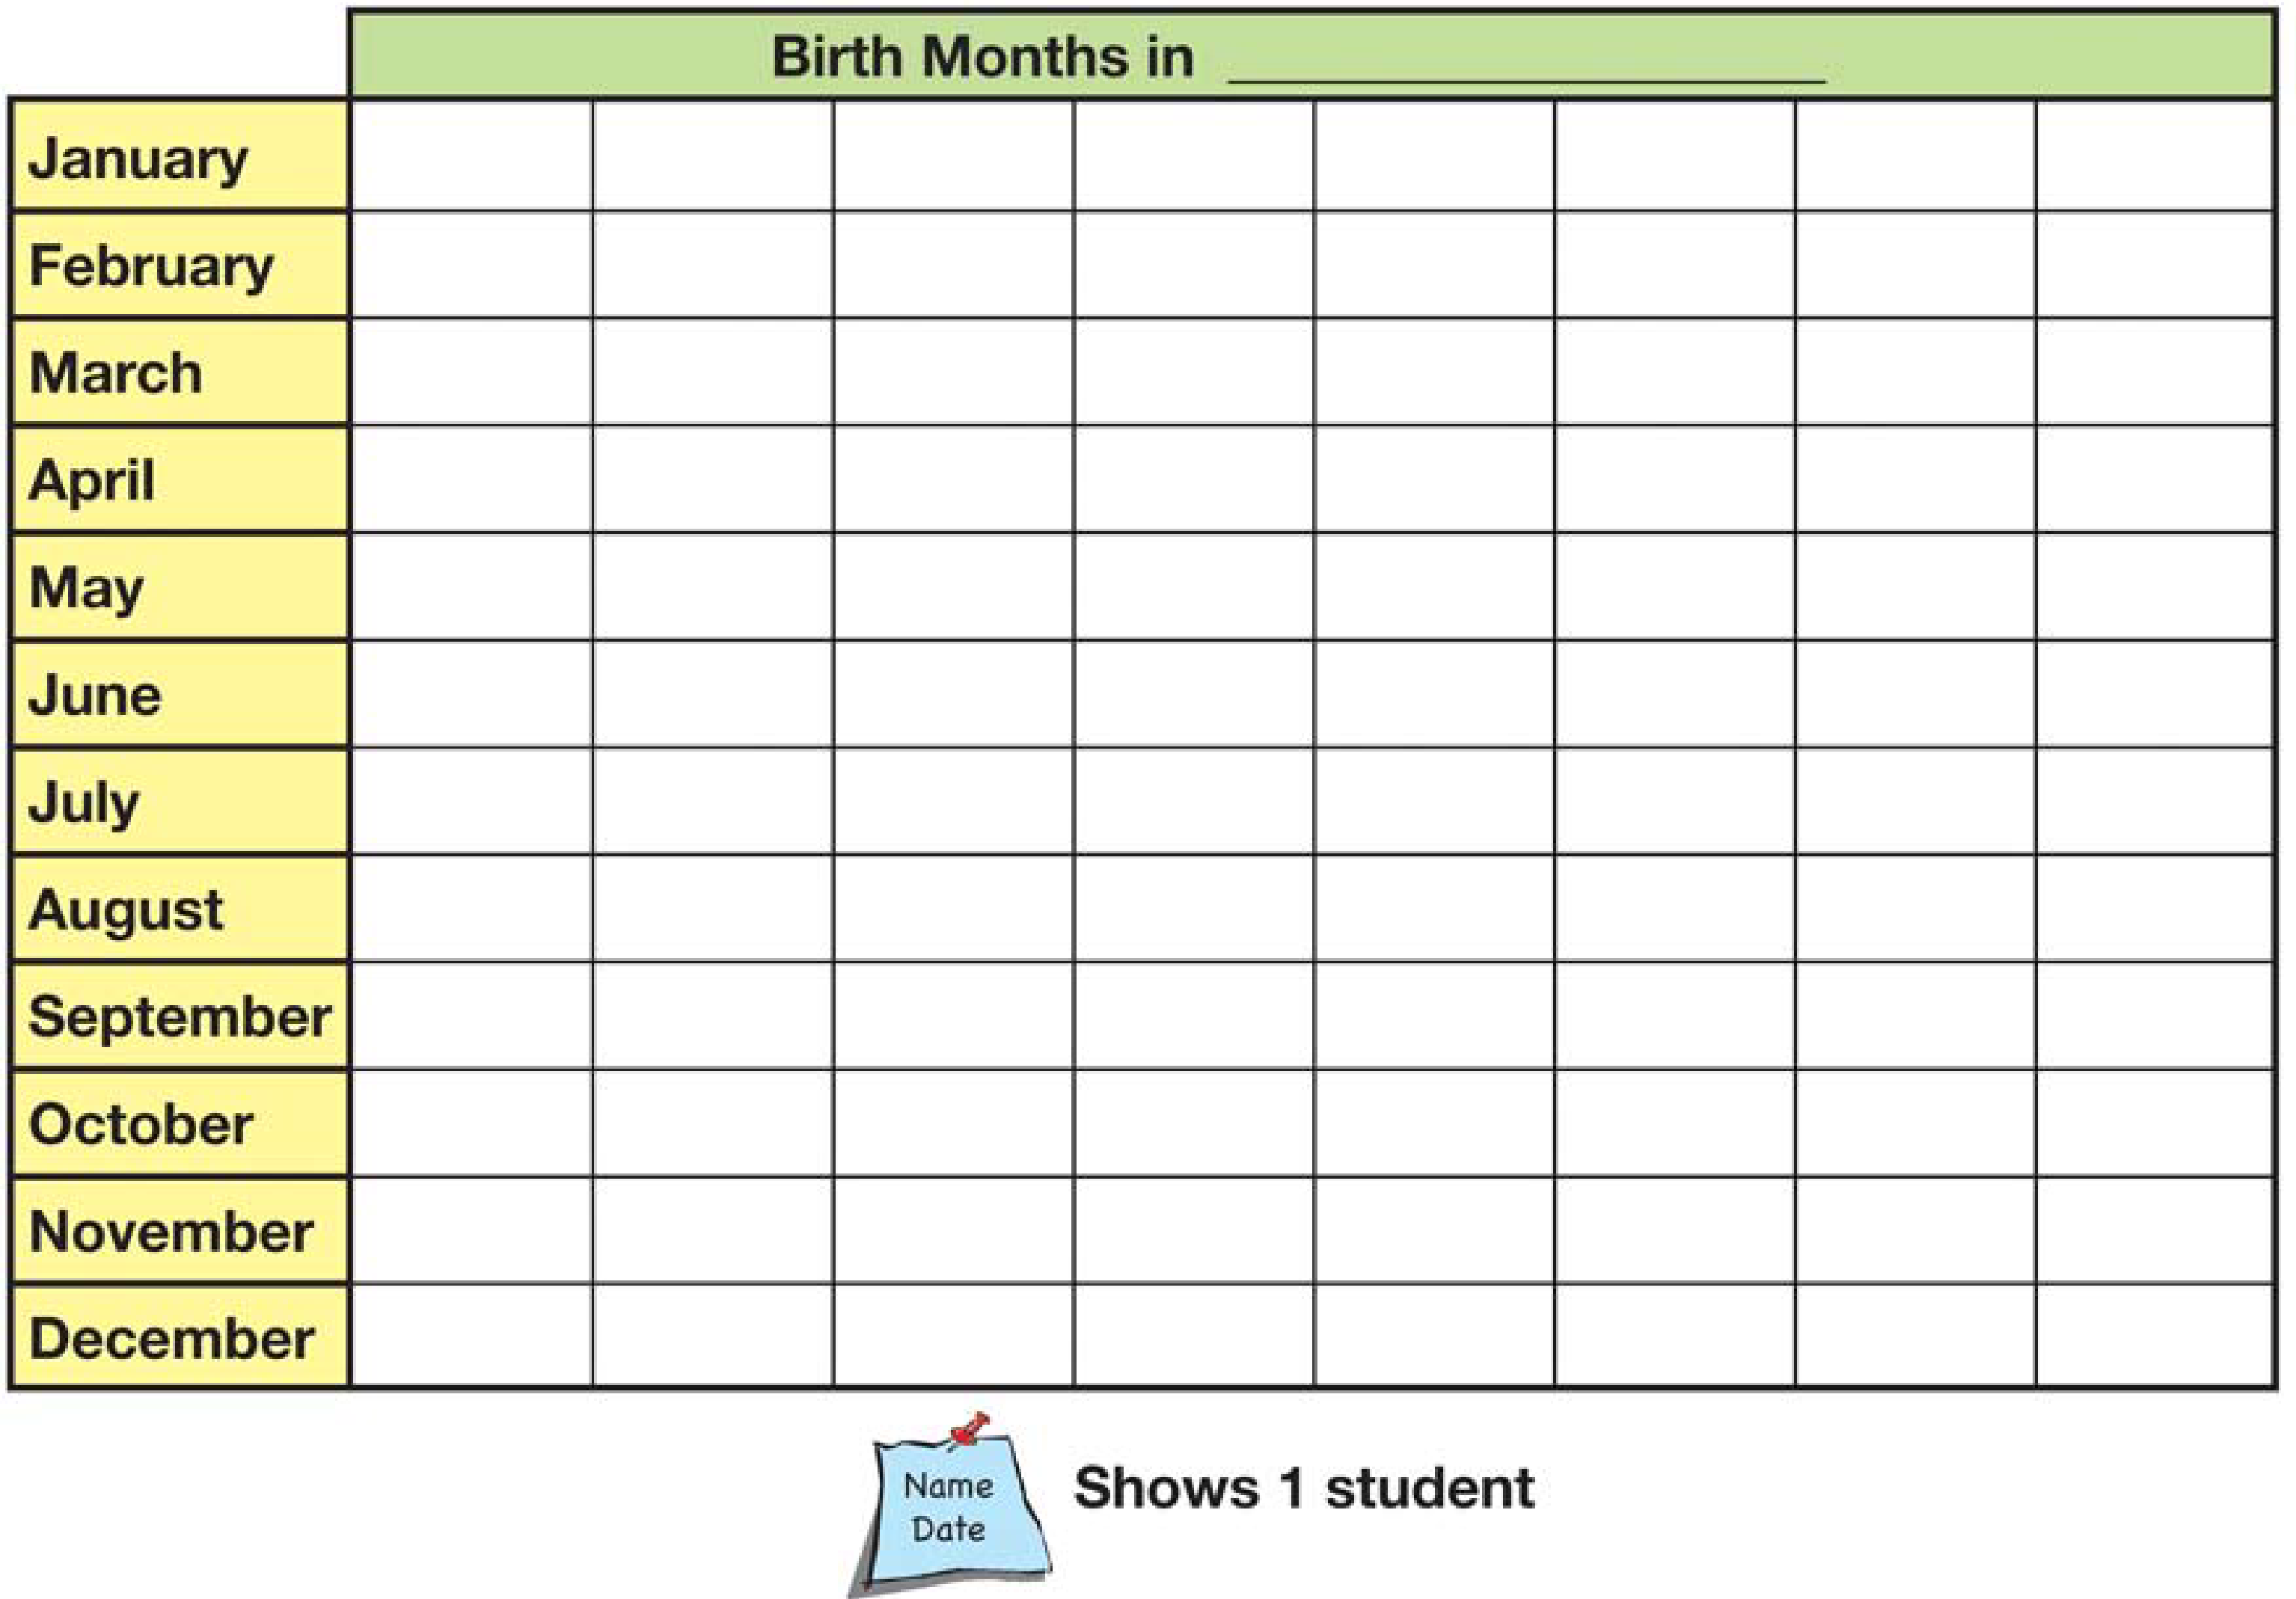
Figure 1: Blank Birth Months Picture Graph
Assessment in this Lesson
| Assessment | Expectation Assessed | Math Practices Expectation Assessed |
|---|---|---|
|
Ms. Carter's Class Check-In: Questions 8–12 with Feedback Box Student Activity Book Pages 7–8 |
|
|