Lesson 5

Life Spans

Est. Class Sessions: 1–2
X

Mathematical Standards

5.NBT.A
Understand the place value system. (5.NBT.A.3)
5.NBT.B
Perform operations with multi-digit whole numbers and with decimals to hundredths. (5.NBT.B.7)
5.G.A
Graph points on the coordinate plane to solve real-world and mathematical problems.(5.G.A.2)
5.OA.B
Analyze patterns and relationships. (5.OA.B.3)

Standards for Mathematical Practice

MP1.
Make sense of problems and persevere in solving them.
MP2.
Reason quantitatively.
MP3.
Construct viable arguments and critique the reasoning of others.
MP4.
Model with mathematics.
MP7.
Look for and make use of structure.

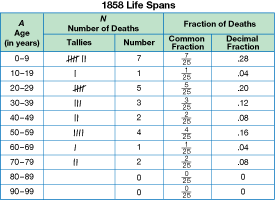
Students compare human life span data from 1858 to life span data from 2014. Students organize each data set into groups or bins to compare and analyze the data. Students then use fractions and graphs to describe and compare the different age groups represented in the data. This lesson prepares students for the Live Soap Bubbles lab in Lesson 6.

Content in this Lesson

  • Using fractions and decimals to represent the same quantity [E1].
  • Comparing fractions and decimals [E3].
  • Grouping data into bins to see patterns.
  • Using data tables and graphs to organize and display data involving decimal values [E10].
  • Making bar graphs using binned data [E10].
  • Finding the median of a data set [E11].
  • Estimating sums [E9].
  • Describing a data set represented in a graph and data table [E11].
  • Connecting mathematics to real-world situations.
  • Translating between graphs and real-world situations.
  • Apply relationships and patterns to solve problems and make predictions [E12].

Daily Practice and Problems M–N

M. Fractions and Decimals

N. Problem Solving

X

Materials for Students

Daily Practice and Problems Lesson Homework Assessment

Student Books

Student Guide
Student Activity Book

Teacher Resources

Teacher Guide - digital

Supplies for Students

  • calculator

Supplies for Student Groups

  • chart paper
  • sentence strips, optional

Materials for the Teacher

Assessment in this Lesson

Assessment Expectation Assessed

Life Spans
Student Guide
Pages 380–383
with corresponding
Feedback Box
Teacher Guide - digital

E1.
Represent numbers to the thousandths using fractions, decimals, words, area models, base-ten pieces, number lines, and expanded form.
E3.
Compare and order decimals to the thousandths using place value understanding and benchmarks.
E9.
Estimate sums, differences, products, and quotients involving decimals and fractions.
E10.
Use data tables and graphs to organize and display data involving decimal values.
E11.
Describe a data set by interpreting graphs and data tables, identifying patterns, and using the median.
E12.
Use relationships and patterns in a data set to make claims and predictions.

Vocabulary in this Lesson