


Live Soap Bubbles
Est. Class Sessions: 2–3Developing the Lesson
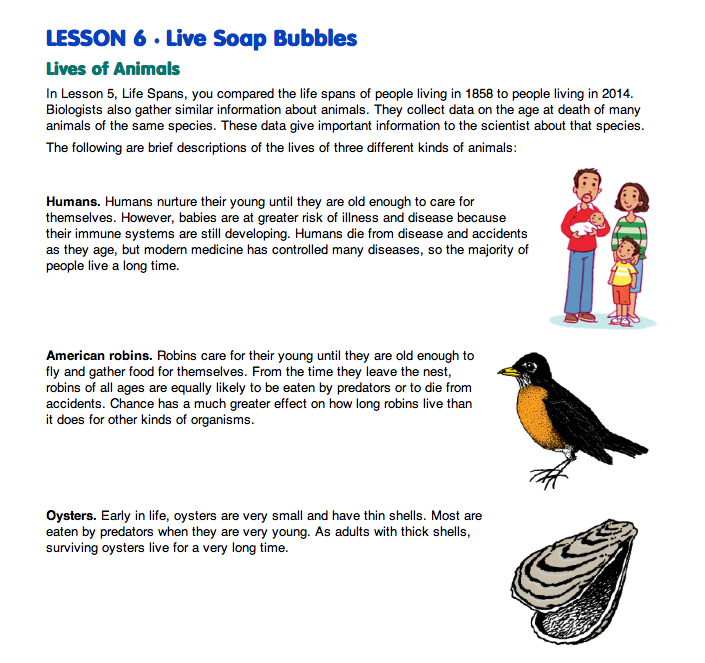
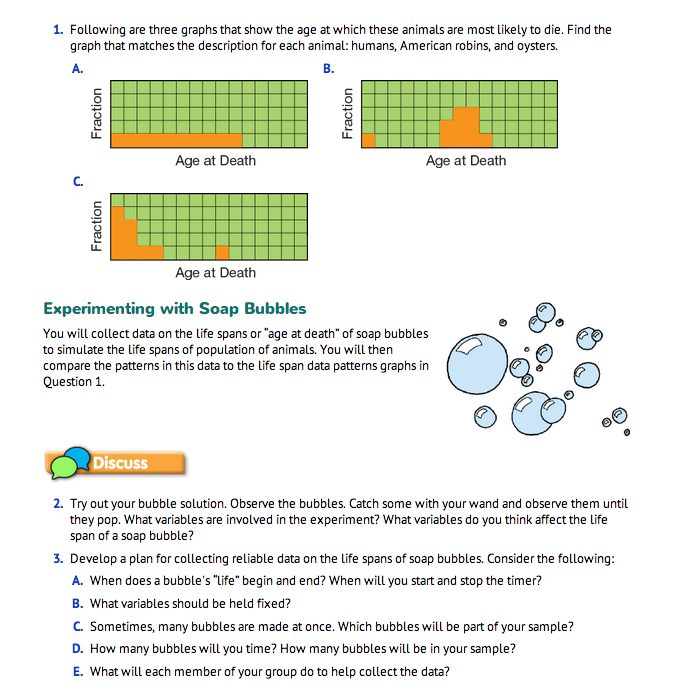
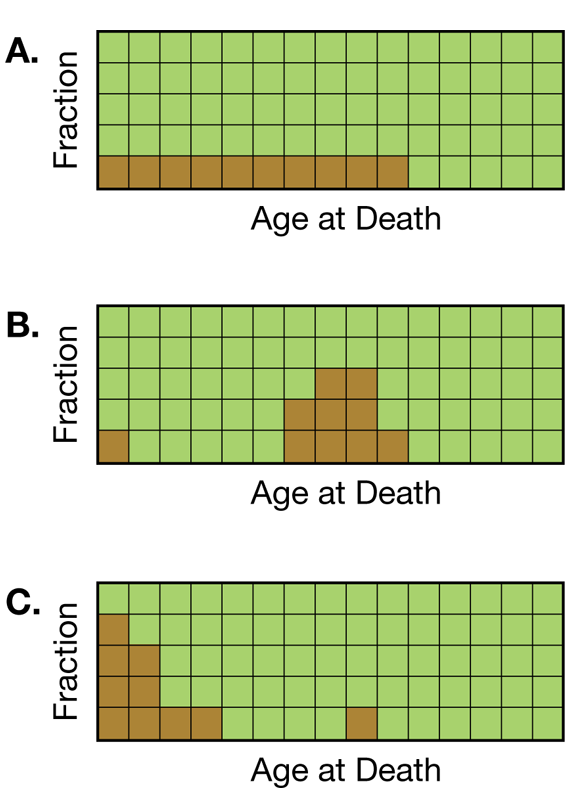
Analyze Animal Life Spans. Read and discuss the descriptions of the lives of different kinds of animals in the first section of the Live Soap Bubbles pages in the Student Guide. Question 1 asks students to match three descriptions of the life spans of three kinds of animals with three different graphs showing the fraction of animals that die at any given age. Each graph has a characteristic shape. Be sure students can correctly identify each graph. Graph A matches the description of the life spans of American robins, since robins of all ages are equally likely to die. Graph B displays the life spans of humans since tall bars to the right indicate that the majority of humans live a long time. Graph C represents the life spans of oysters, since the bars to the left tell us that most oysters die at a young age. These graphs will be compared to the graph showing the fraction of bubbles that burst after any given number of seconds.
Draw the Picture. The second section in the Student Guide, Experimenting with Soap Bubbles, discusses the variables and develops the procedure for the experiment. Question 2 directs students to observe a few bubbles and consider the variables involved in the experiment. The two main variables in the experiment, the time at which a bubble pops and the fraction of bubbles that pop after any given number of seconds, are analogous to the age at death of an animal and the fraction of deaths at any given age. After students have had a chance to discuss the variables with a partner, lead a whole class discussion of these variables. The following variables are also involved in the experiment since they may affect the life span of a bubble:
- the type of bubble solution,
- whether the bubble is held on a wand or allowed to drop to the ground,
- the ventilation in the room,
- the air temperature,
- the humidity, and
- the size of a bubble.
Direct students' attention to Question 3. Use this question to develop a data collection plan as a class. This discussion will prepare students to draw and label a picture of the lab procedure in Question 4.
Ask:
Question 4 directs students to draw a picture that shows the procedures and identifies the variables. Use the pictures to check that students have a clear idea of the procedures and the variables involved in the experiment. See Figure 2 for an example of a student's labeled drawing. Then, each group should proceed with the investigation as independently as possible so that you can assess their abilities to carry out an experiment.
Collect Data. Before students begin collecting data, they should time a few bubbles (Question 5). Since the number of seconds the bubbles live can vary greatly, students will need to bin the data. Question 6 asks them to use this preliminary data to predict what the graph of the life spans of the bubbles will look like by drawing a sketch or describing the graph in words. The question prompts students to connect the length of time the bubbles last to bars on a graph. They can use the graphs in the Student Guide that show the life spans of American robins, oysters, and humans as examples.
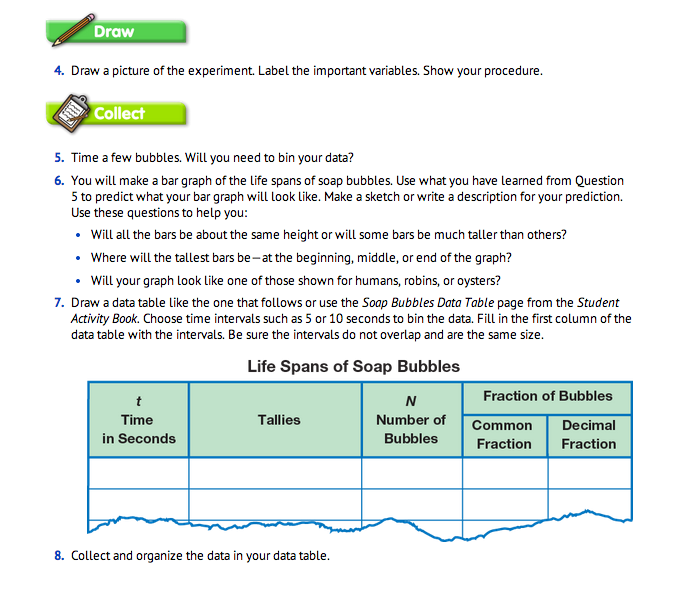
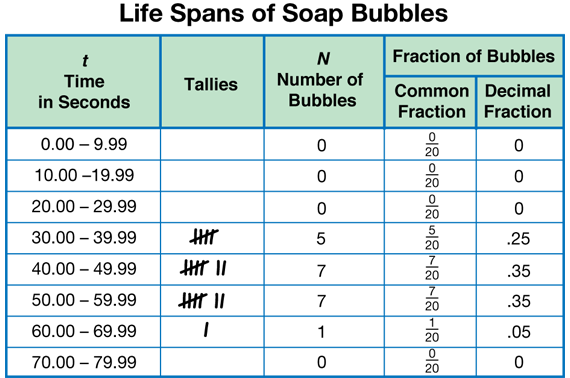
The preliminary data from Question 5 will also give students an idea of the possible values for the length of time the bubbles will last using your brand of bubble solution and given the conditions in your room. Before students begin collecting and recording data, they should fill in the first column of their data tables with intervals (Question 7). Students will need to bin the data so that the scale of the graph is reasonable and so they can look for patterns in the graph. We recommend that students use intervals of five or ten seconds. The sample data in Figure 3 is for 20 bubbles using a commercially available bubble solution. The first column in the data table shows intervals of 10 seconds that are all the same size and do not overlap. Student collect and record their data in Question 8. See Figure 3 for a sample completed data table.

Graph the Data. Question 9 directs students to make a graph of the data with time (in seconds) on the horizontal axis and the percent of bubbles on the vertical axis. Students should complete their graphs as independently as possible. Figure 4 is a graph of the sample data. Note the horizontal axis is scaled by 10s since the width of each interval (bin) in the data table is 10 seconds.
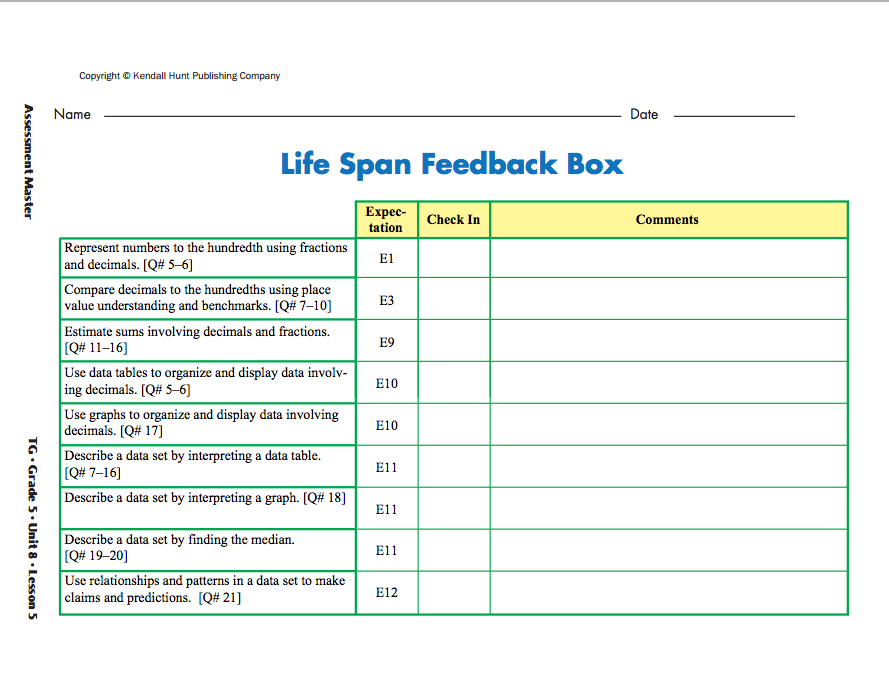
Analyze the Data. Display the Math Practices page from the Student Guide Reference section and focus students' attention on Math Practices Expectation 5.
Ask:
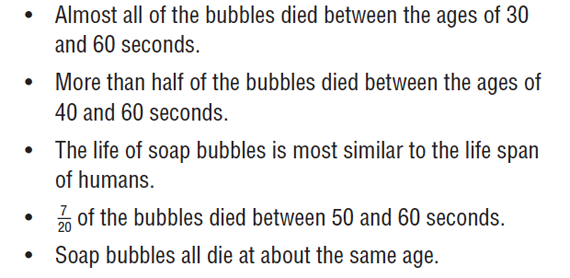
Direct students to discuss Questions 10–12 in a small group. While students are working, circulate and identify students who will share their statements. Provide each student with sentence strips to record the true statements about their data. See Figure 5 for a list of sample statements about the data in Figures 3 and 4.