


Weather 2: Winter Skies
Est. Class Sessions: 1Developing the Lesson
Part 1: Collecting Weather Data
Launch the Investigation. Remind students of the Weather 1: Eye on the Sky lab they completed in October.
Using questions like these, ask students how skies this month might compare to skies in October:
Students' responses are likely to be disparate and will vary depending on your geographic location. Tally the number of predictions for October and for February. Note students' predictions to refer to when finishing this lab at the end of the month.
Help students recognize that they can find the answer if they compare the data they collected in October with the data for the current month. Suggest that they repeat the Weather 1: Eye on the Sky lab with one change. Explain that scientists modify experiments to answer specific questions.

Remind students that some things change in an experiment (variables) and some things do not (fixed variables). If available, display a completed copy of the fall Weather Calendar from Unit 1 Lesson 6. Remind students that they recorded the type of sky for each day of a month in the fall.
Ask:
Tell students they will collect a second set of data, keeping the variables time of day and location the same, but changing time of year. See Content Note.
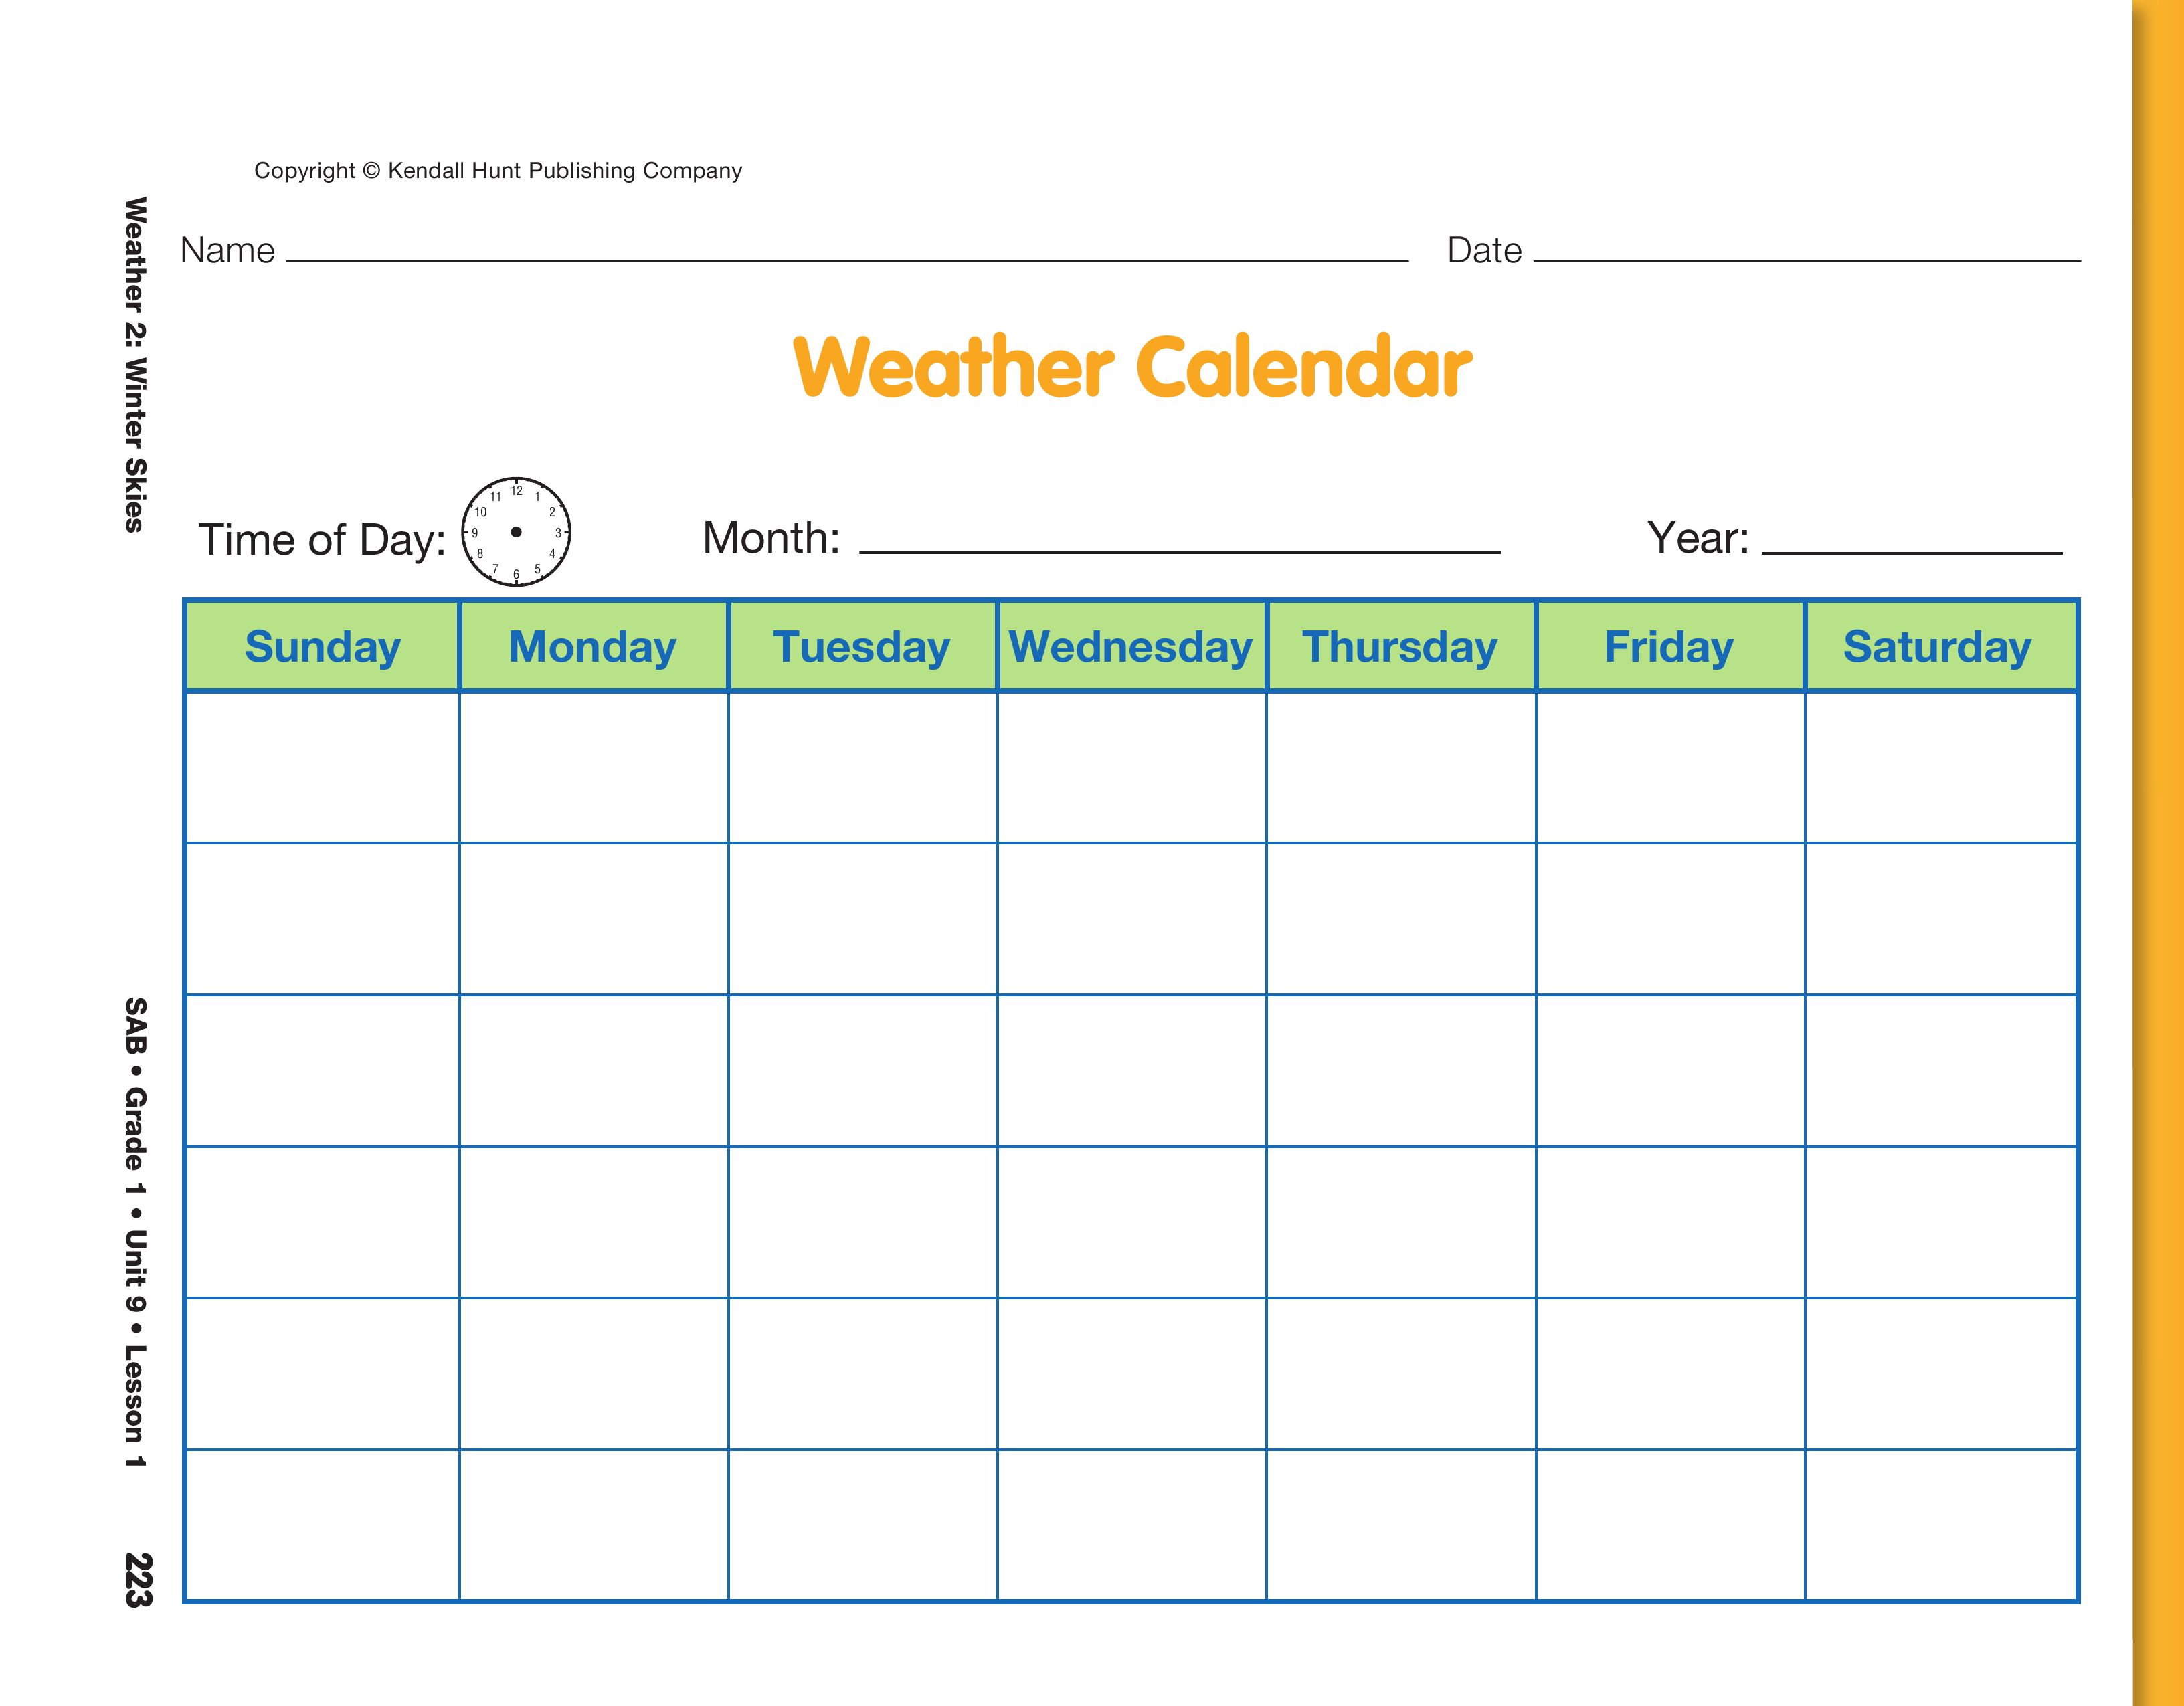
Prepare the Weather Calendar. Display and direct students' attention to the Weather Calendar page in the Student Activity Book. Students will record the data for each day of the month on this page. Using the display, demonstrate how to prepare the calendar as needed, filling in the days of the week and dates.
Since we want to keep the time of day as it was in Weather 1, students should record the same time that they used on their October calendar on the blank clock of the new Weather Calendar.
When students complete the calendar, ask:
Ask student pairs to make up two questions that they can ask another student pair or the rest of the class. Then ask students to ask the questions of one another.
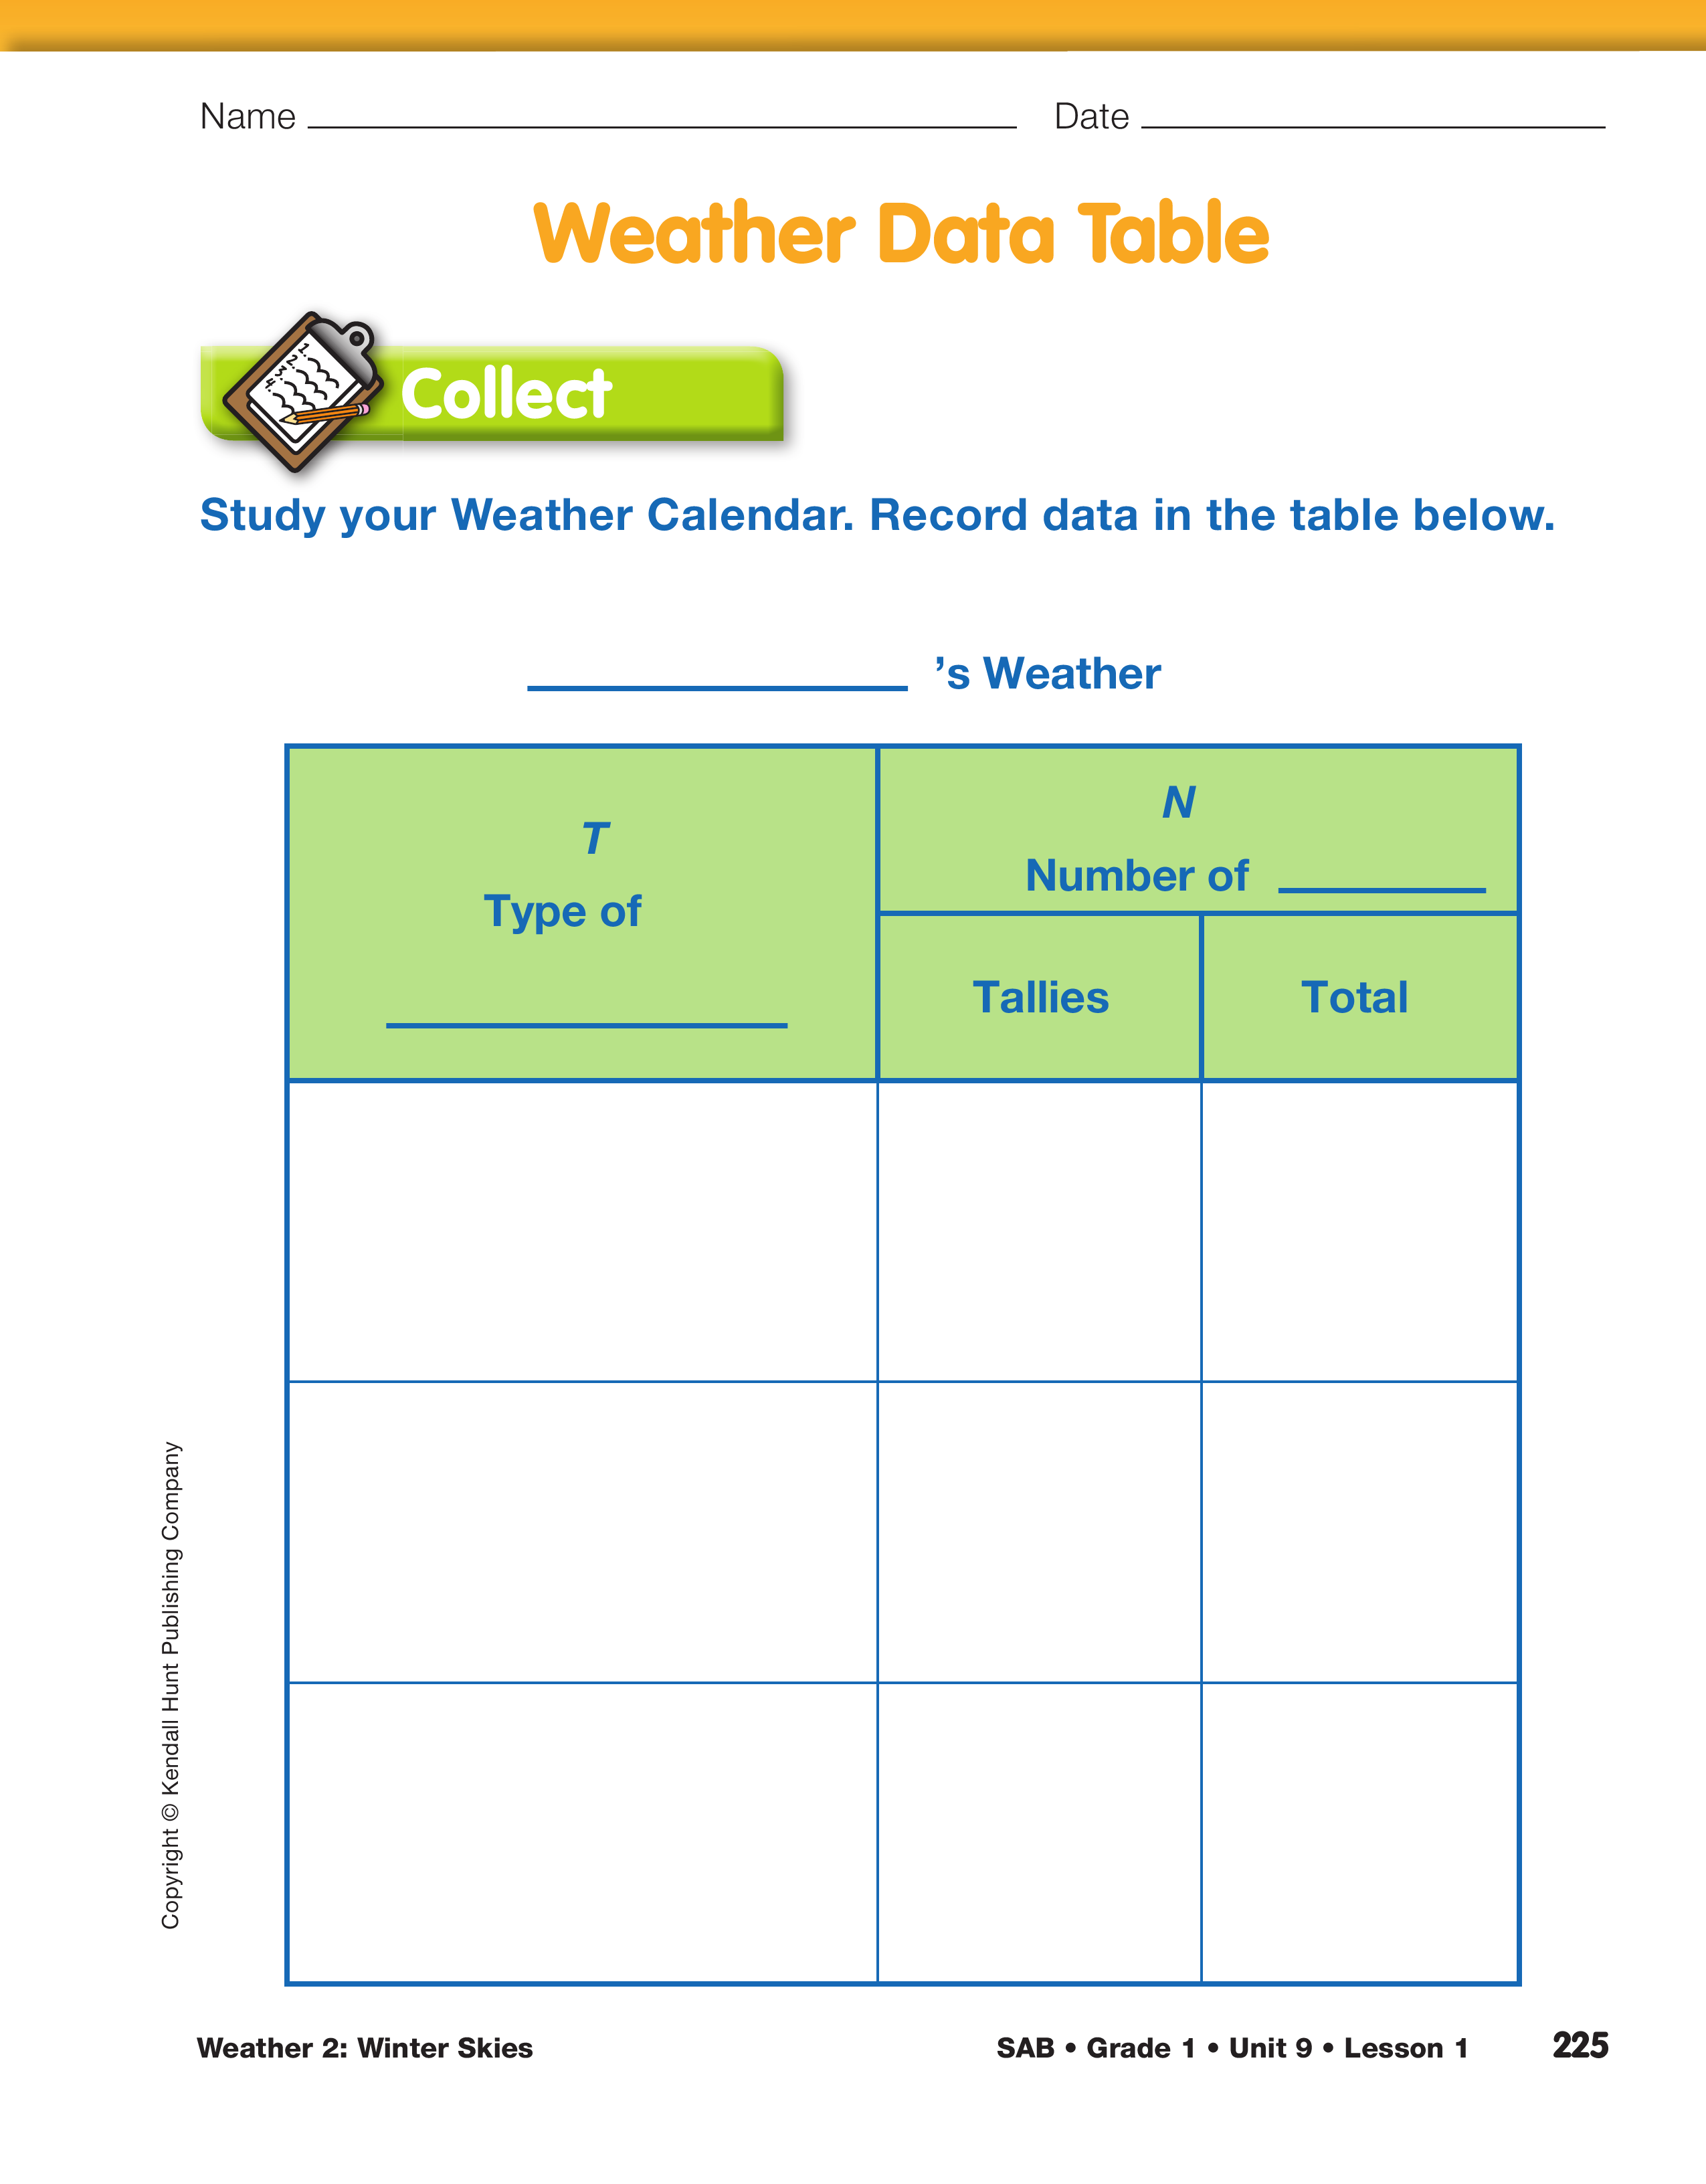
Prepare the Data Table. To determine whether October or February has more sunny days, more cloudy days, or more partly cloudy days, students can use the TIMS Laboratory Method.
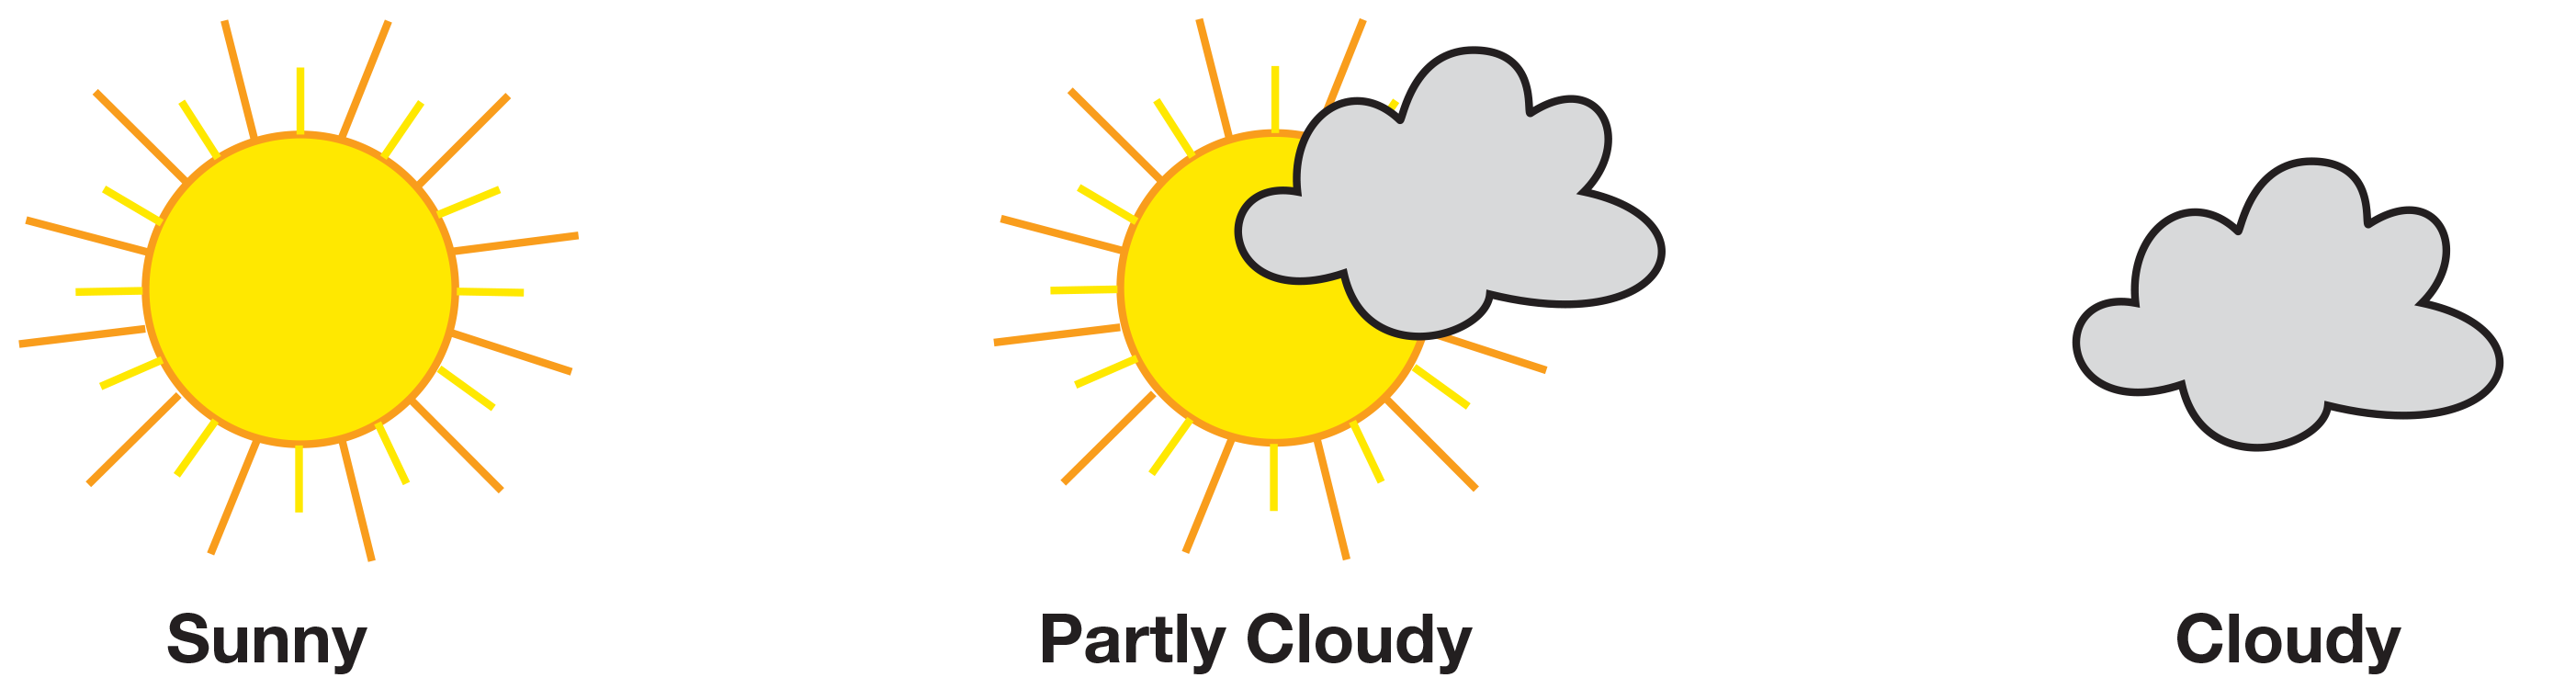
Review the type of sky descriptions used during Weather 1: Eye on the Sky. Reviewing students' perceptions of sunny, partly cloudy, and cloudy will facilitate data collecting and recording. Suggest they draw pictures of sunny, partly cloudy, and cloudy skies in the first column of the Weather Data Table page in the Student Activity Book. See Figure 1.
Ask:
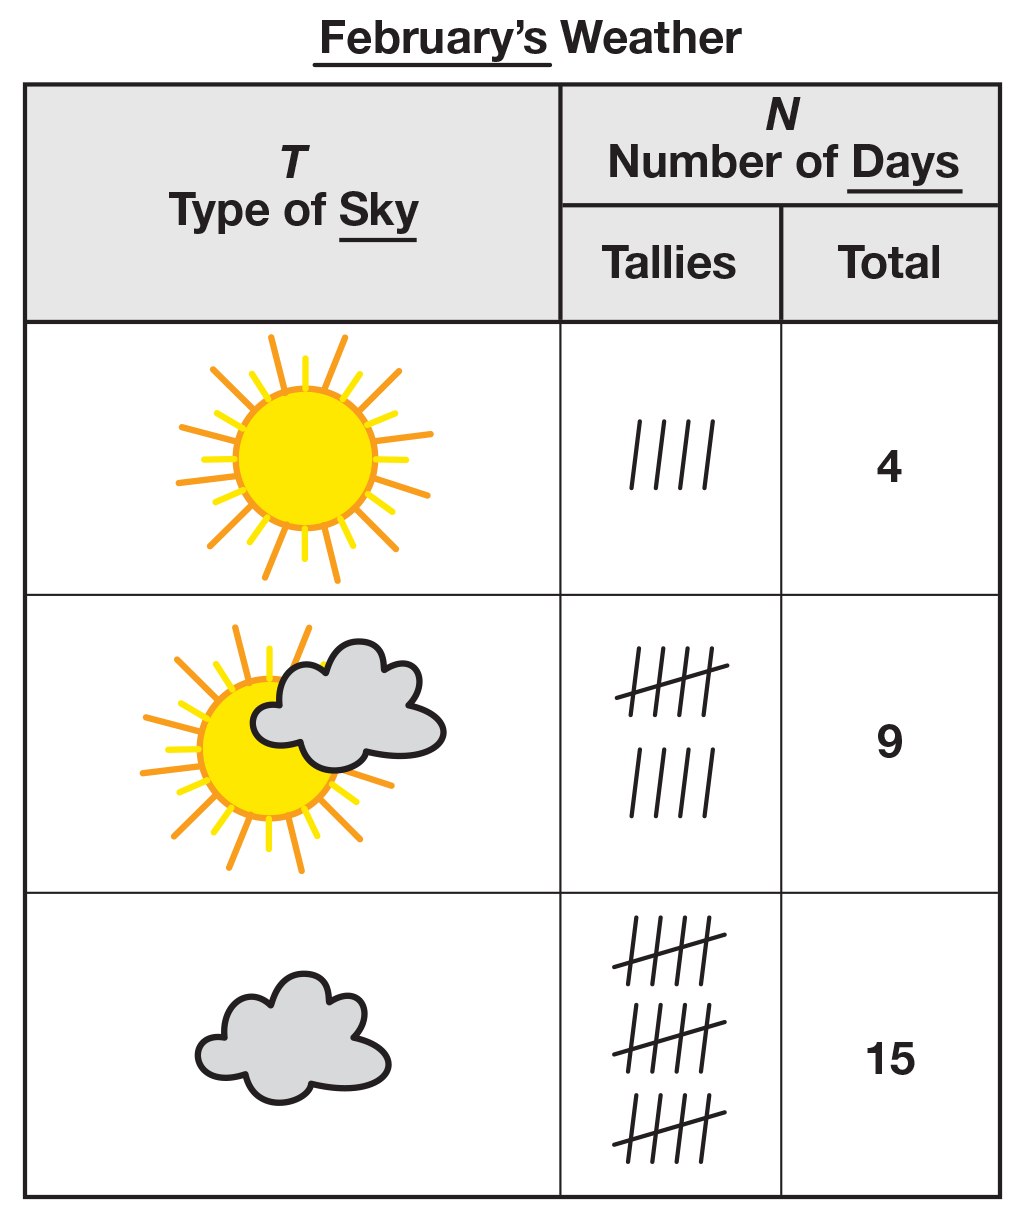
Conduct the Experiment. Each day during February, students check the sky and agree on the type of sky—sunny, partly cloudy, or cloudy. Students record data in two places. First, they use the Weather Calendar page. Have students draw the appropriate value for the type of sky on the appropriate day on the calendar. Be certain students use the same drawings they made in the data table. Second, students place one tally mark in the corresponding row of the Weather Data Table page. See Figure 2.

After one week of data collection, ask students:
Encourage students to suggest reasons for and against making a prediction. If they choose to make a prediction, record their prediction.
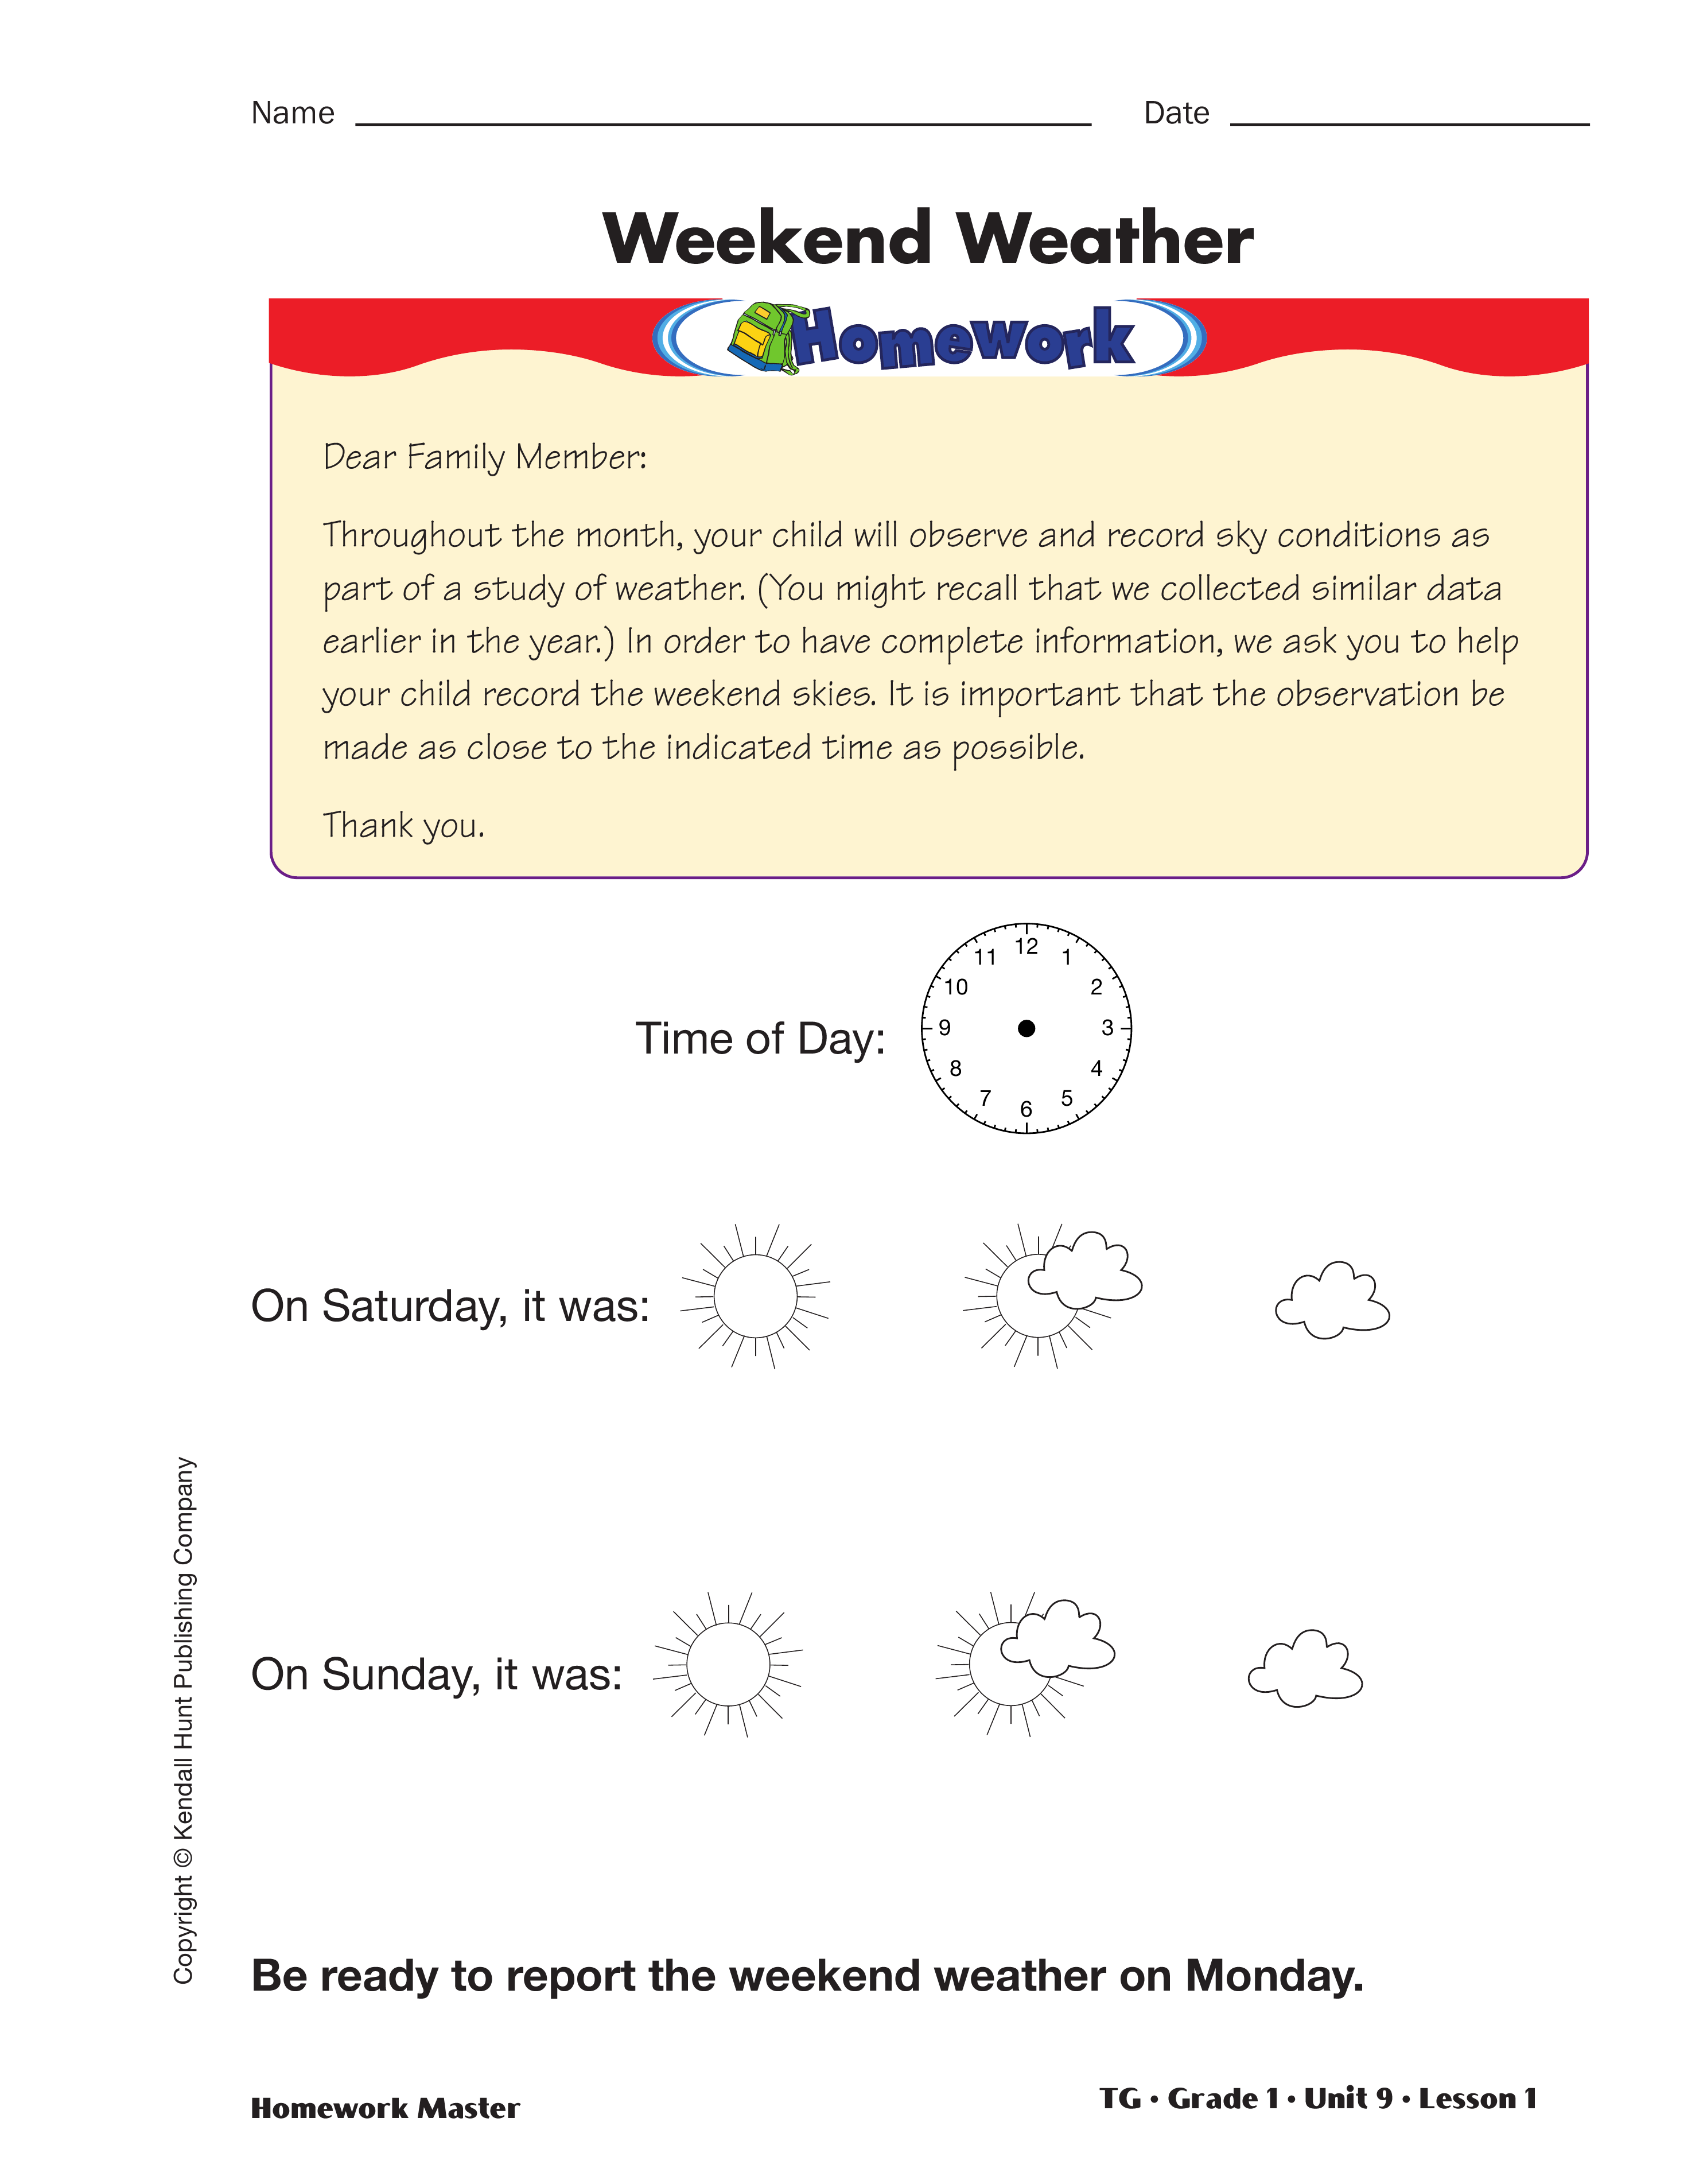
Collect Weekend Weather. This is also a good time to prepare students to collect data at home for the weekend weather using the Weekend Weather Homework Master. Because the time of day must remain constant, students should indicate when to make their observations—the same as the class time—on the blank clock. Students may report different conditions, particularly if a student took a trip. Use the situation to lead a discussion of whether sky conditions are the same everywhere.