


Weather 2: Winter Skies
Est. Class Sessions: 1Developing the Lesson
Part 2: Graphing and Analyzing the Data at the End of the Month
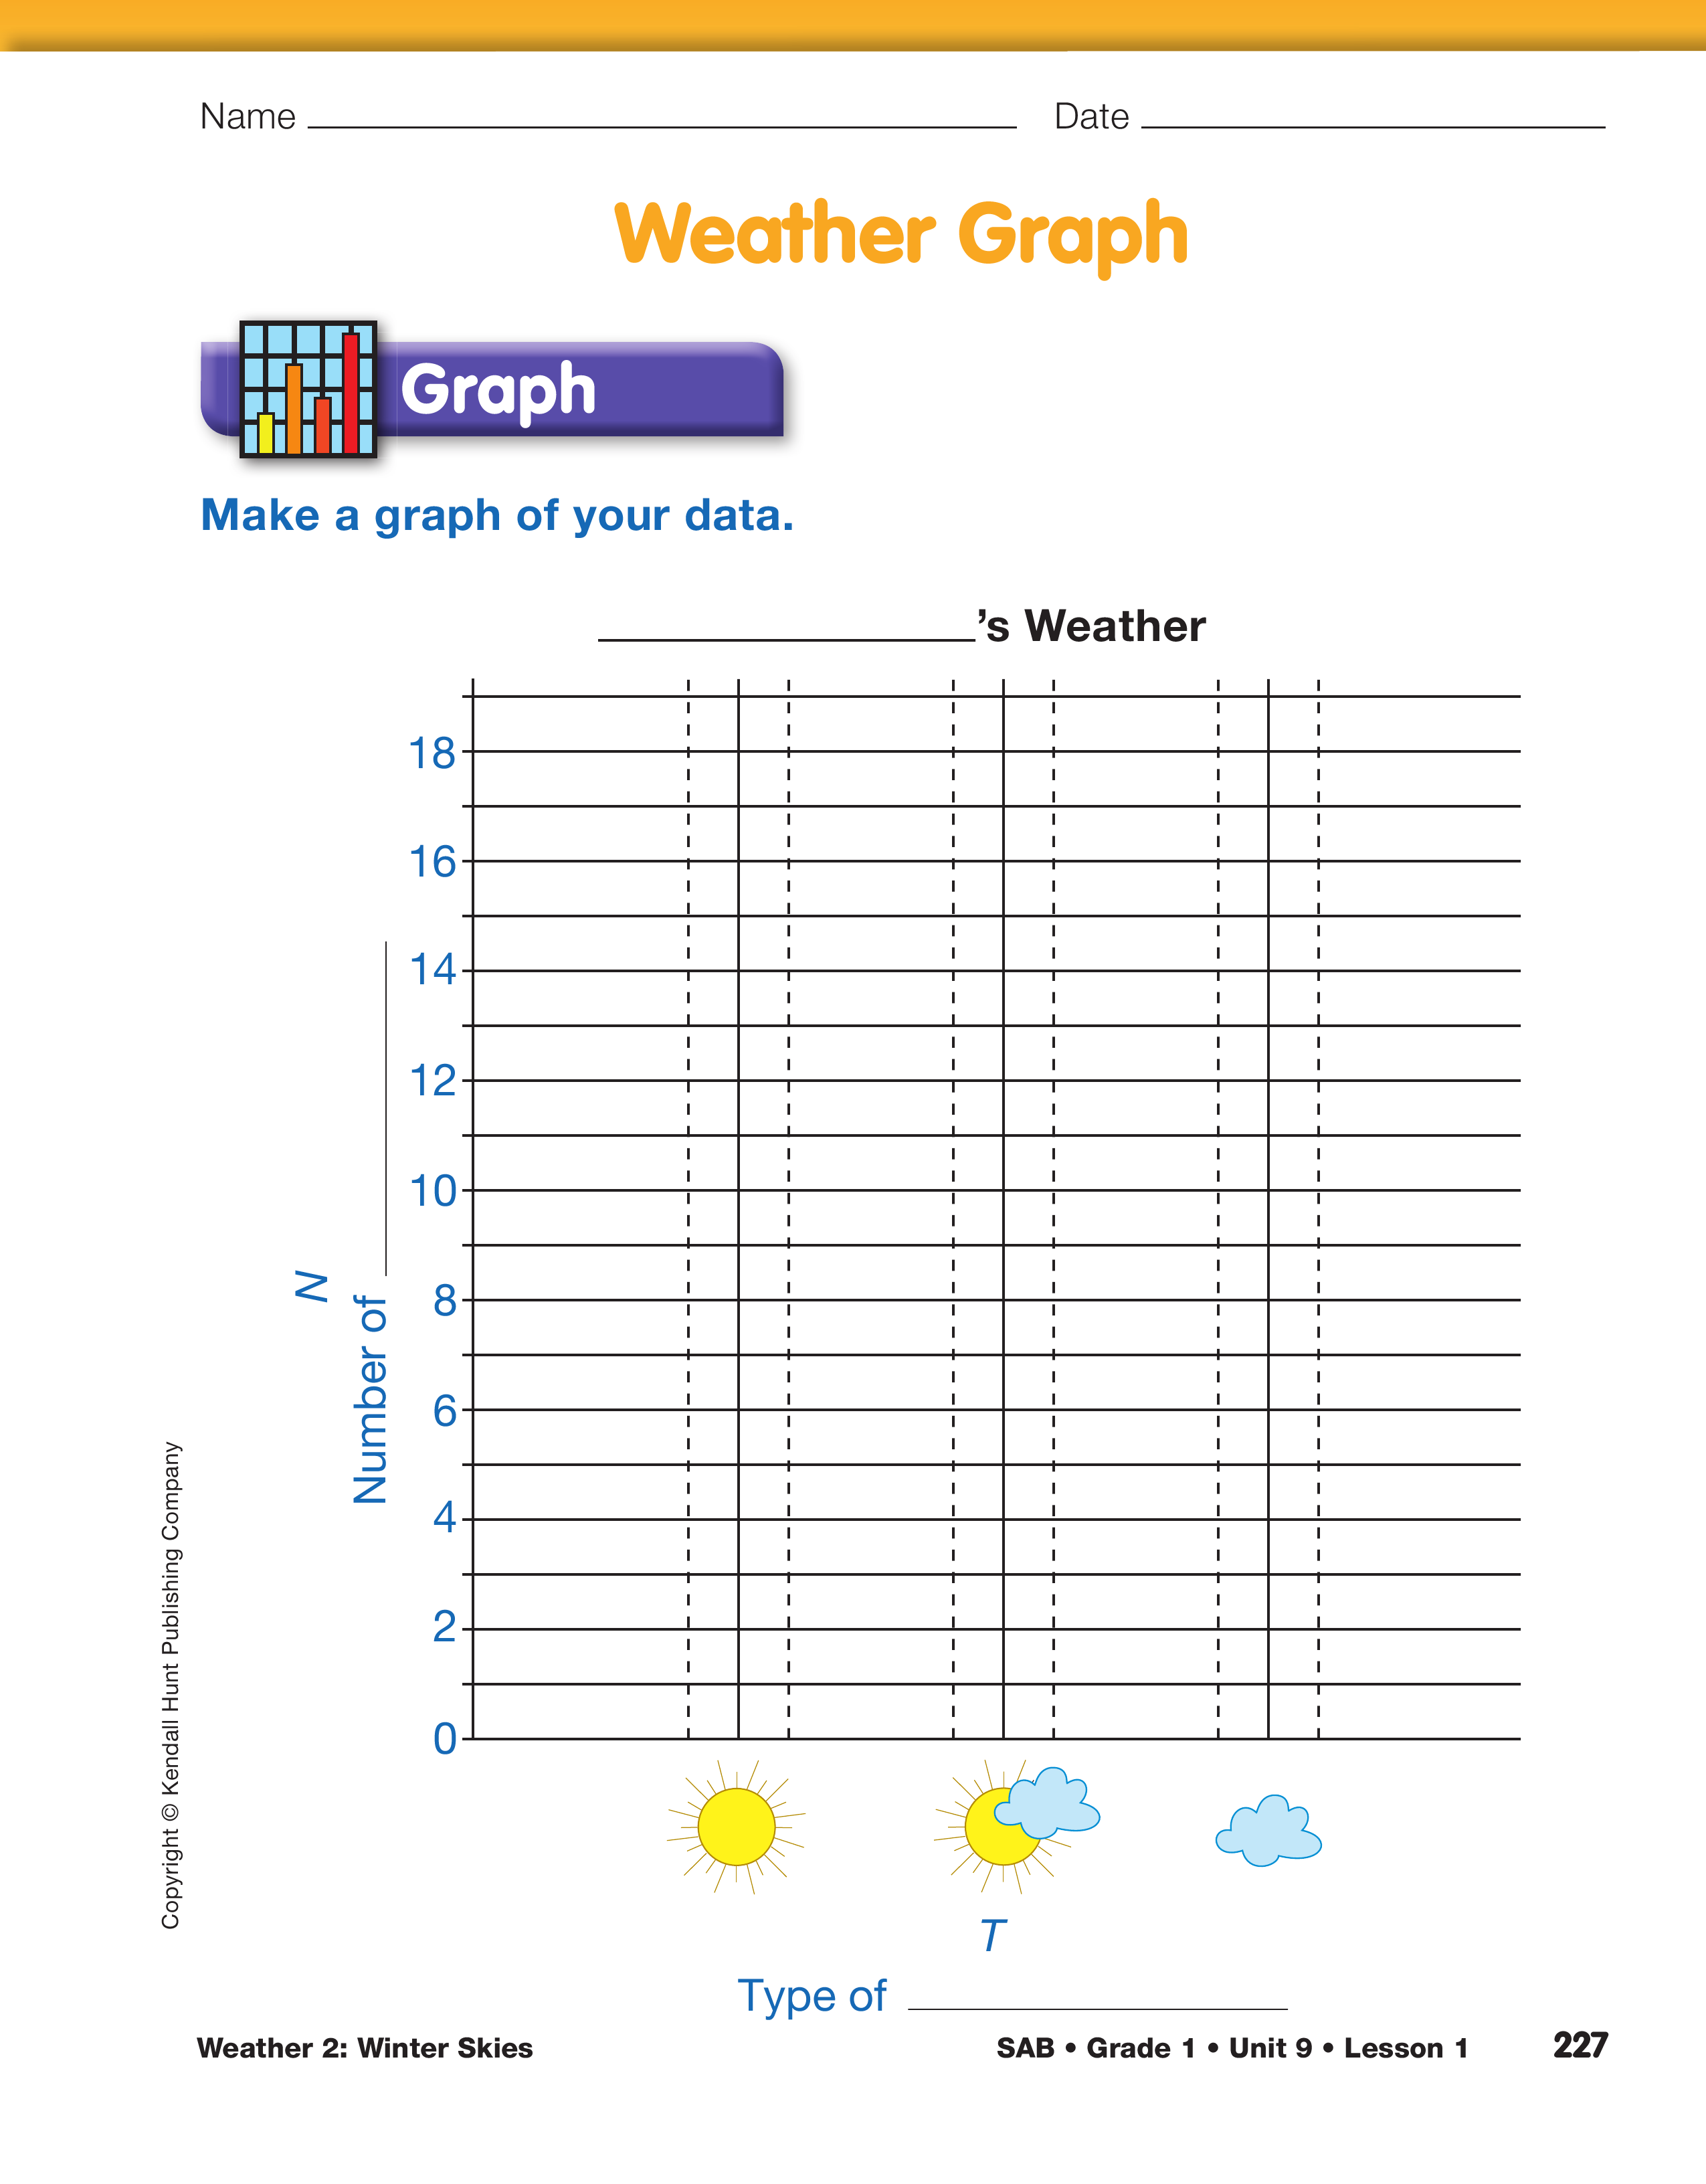
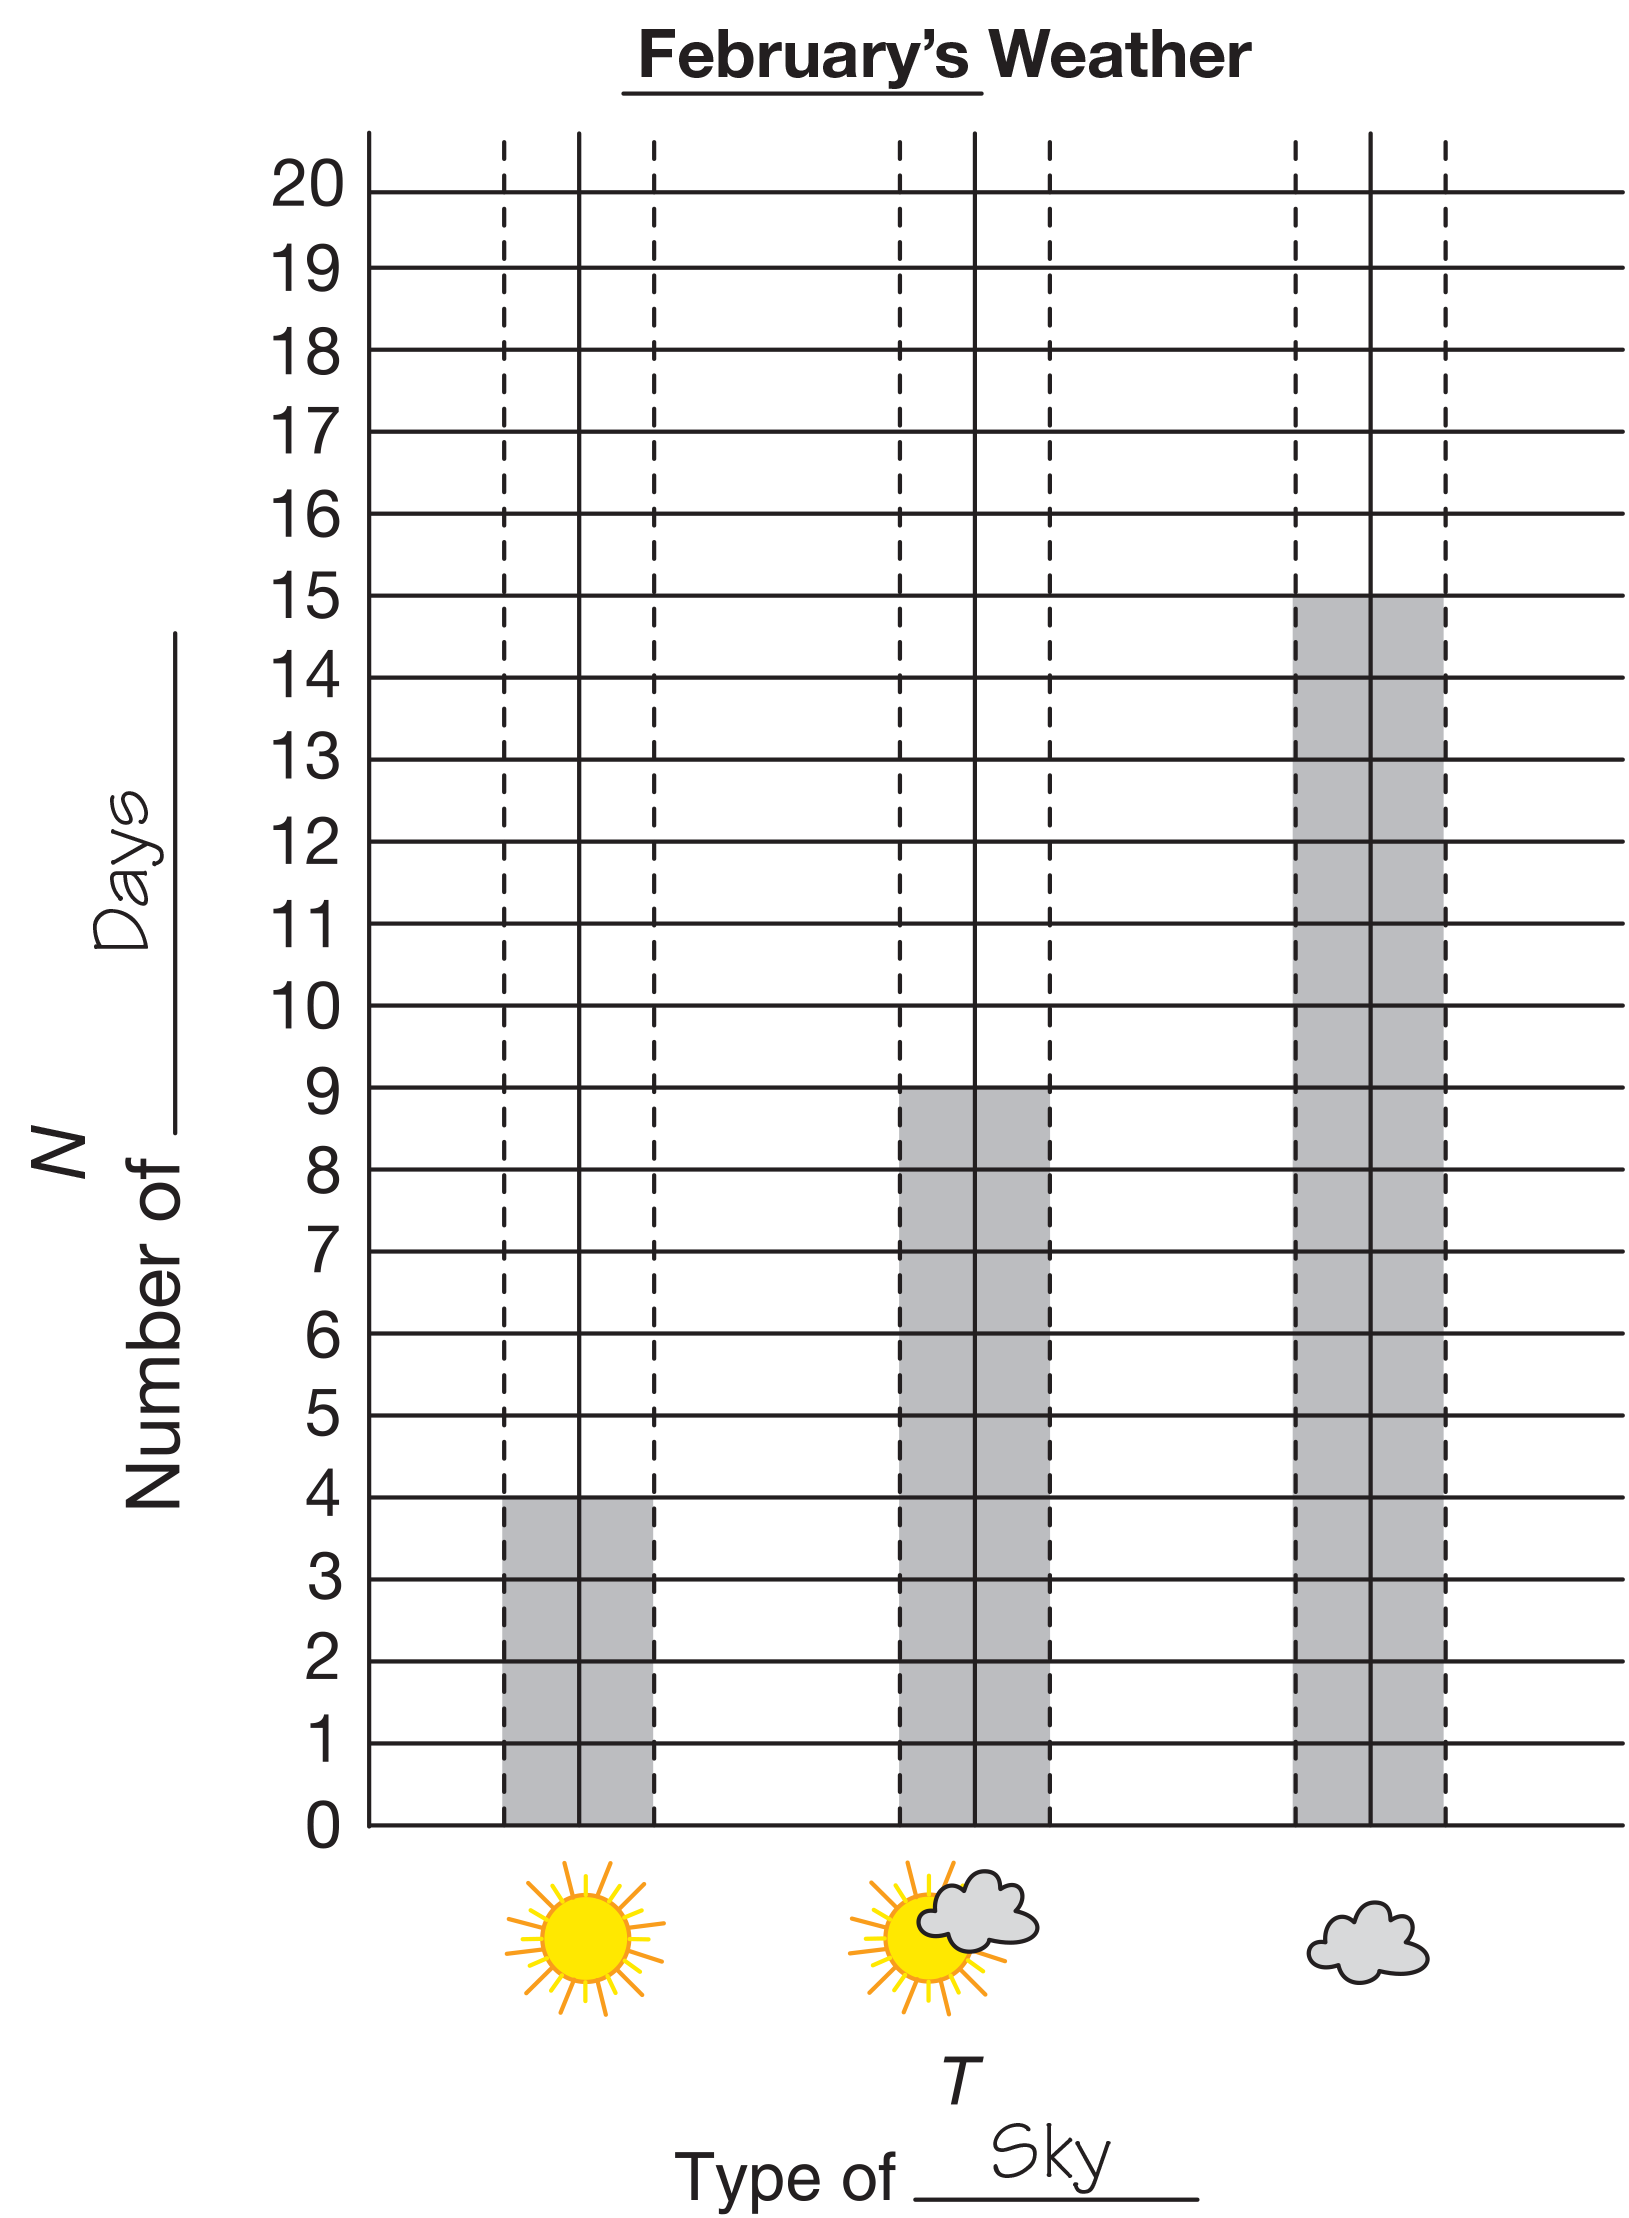
Make a Bar Graph. At the end of February, the process of graphing and analyzing the data begins. Have students transfer their data from their tables to the graph on the Weather Graph page in the Student Activity Book. Students will need to title the graph and complete numbering and labeling the axes. Review the idea that the table and the graph show the same information in different ways. See Figure 3 for a sample graph.
Explore Winter Skies Data. After students complete the graph, ask them to share some of the information it tells them about the data.
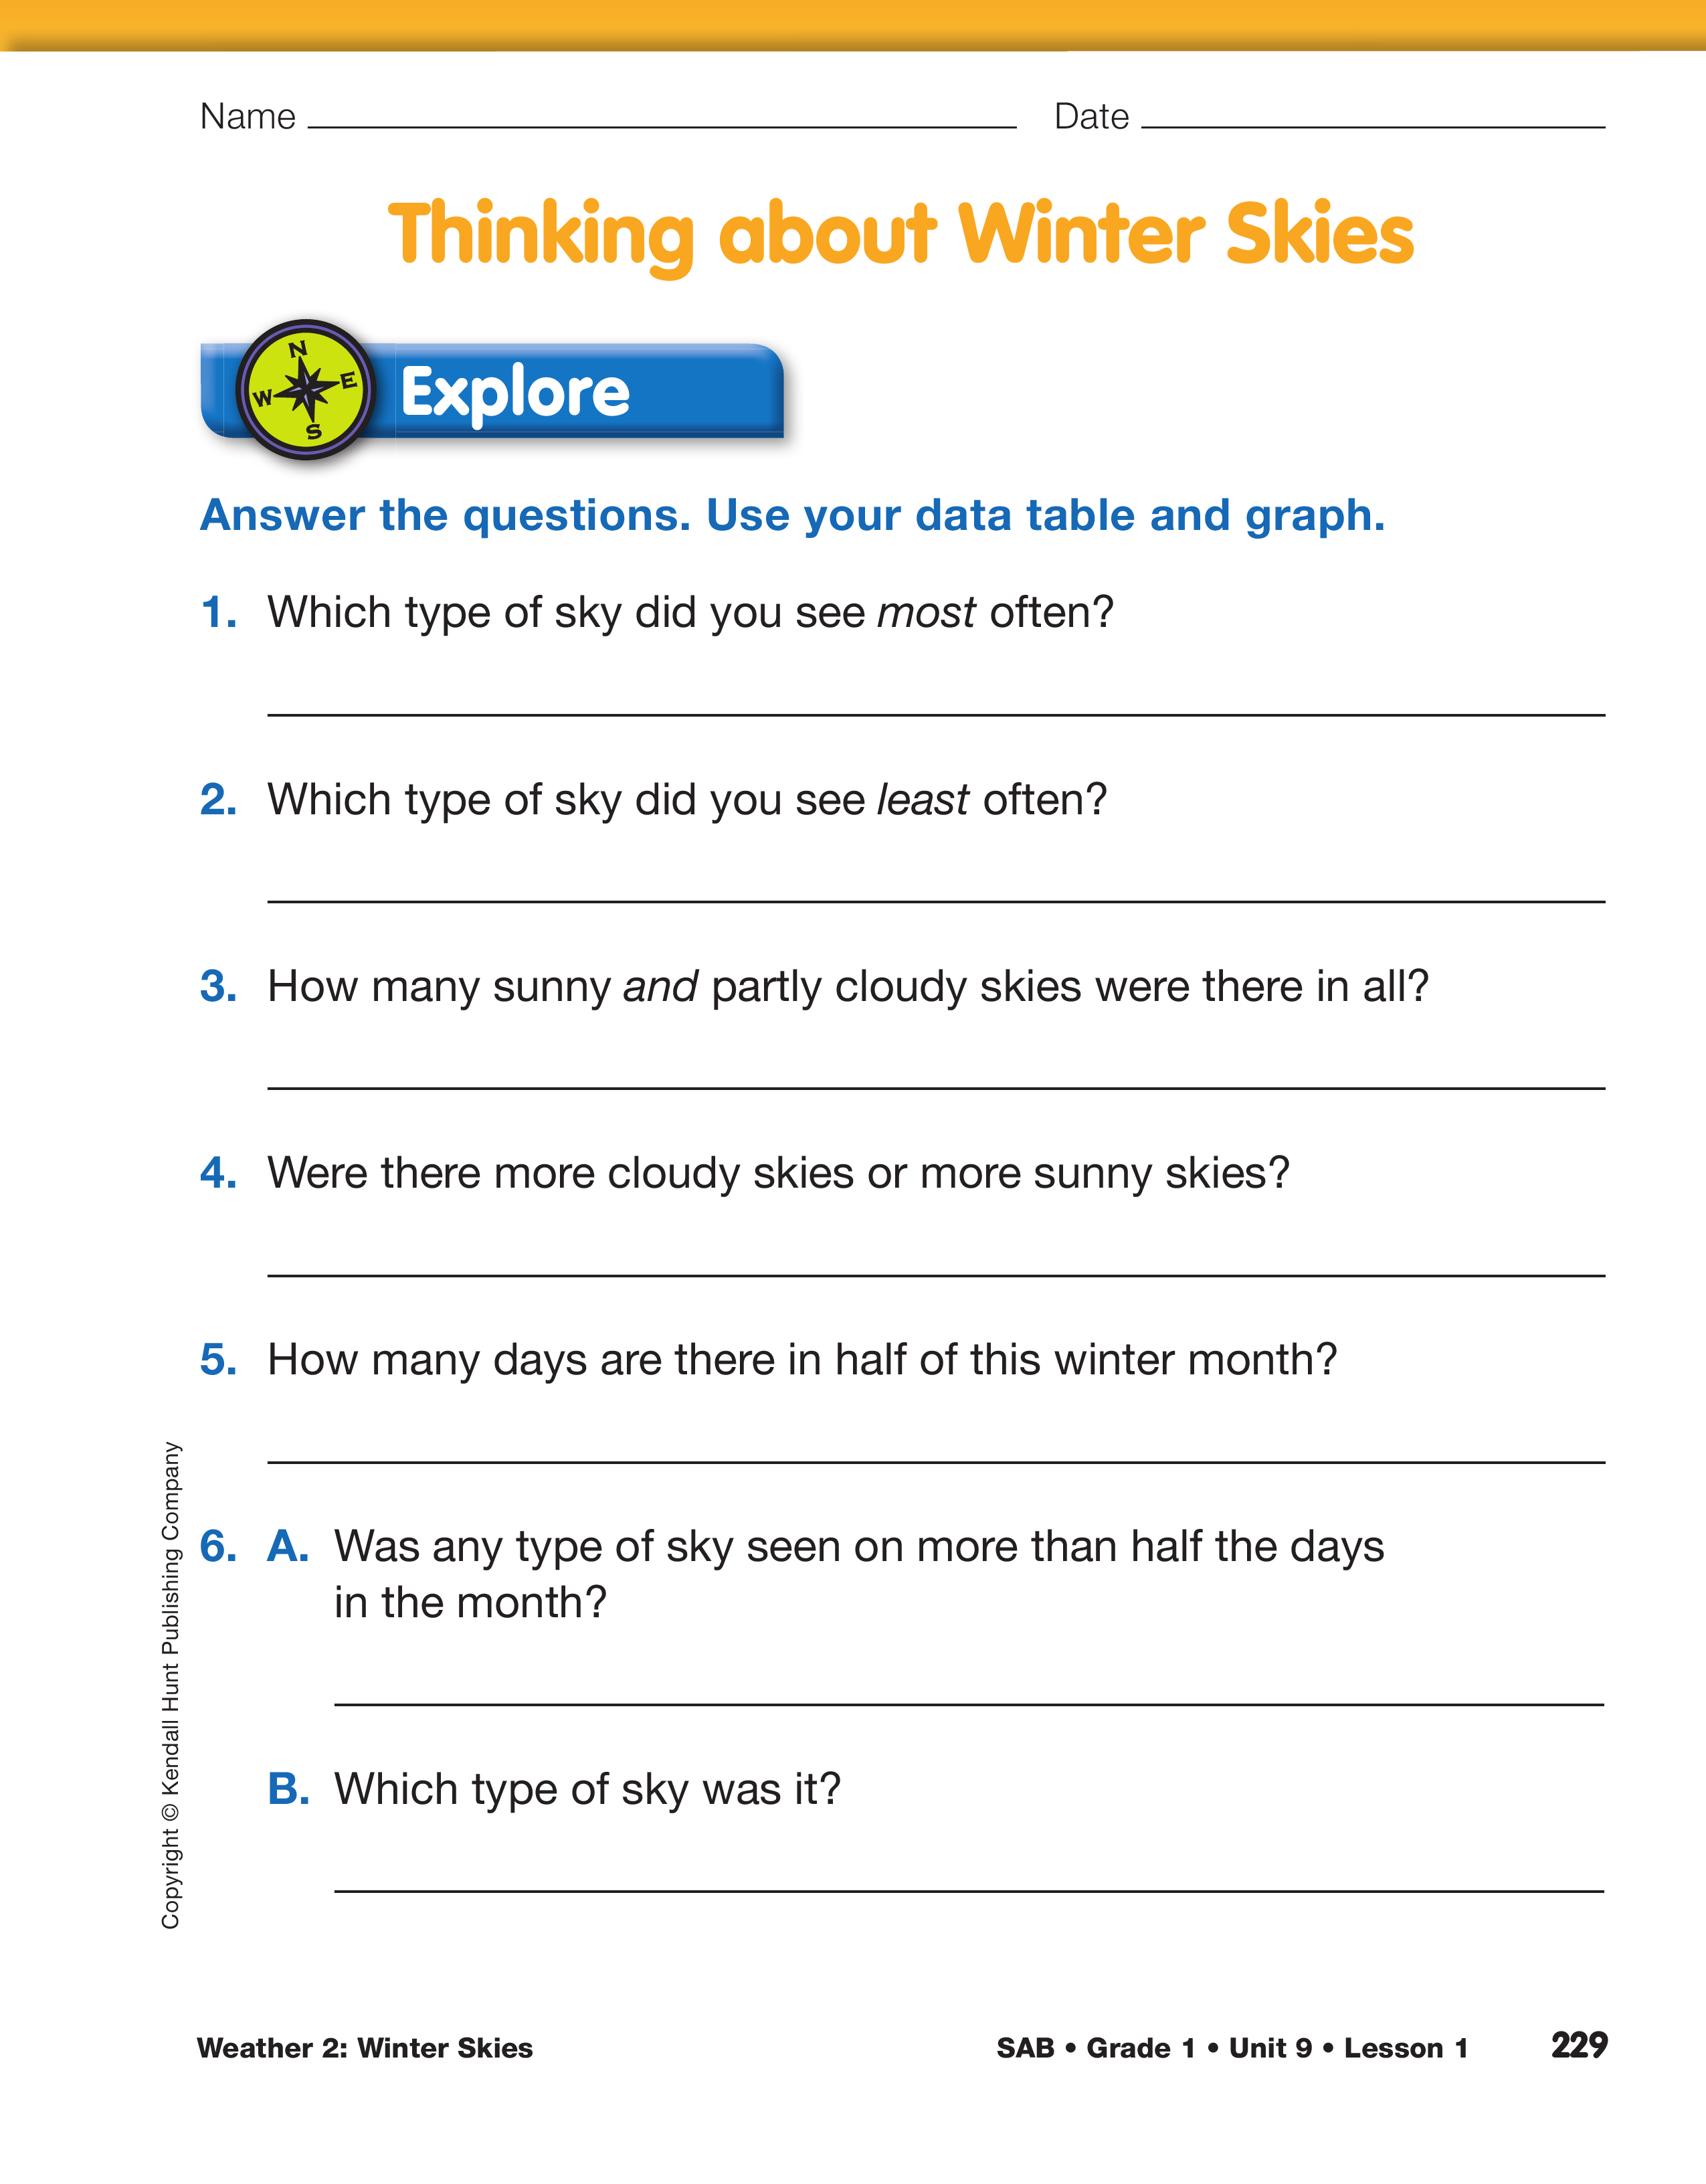
Ask questions such as:
Strategies for finding half of 28 days might include folding the calendar in half or counting out 28 cubes and making two equally tall towers. Students can then use their data tables or graphs to see if one type of sky occurred on more than half the days.
Assign the questions on the Thinking about Winter Skies page in the Student Activity Book to individuals or pairs.
Compare Fall and Winter Skies Data. Display the completed October graph from Weather 1 and demonstrate some ways to tell the story of a graph.
Ask:
Some students may eagerly point out that the number of days in the two months was not the same. Acknowledge this difference; then direct students' attention to the shape of the data on the graph, that is, remind them of each graph's story. The shape of the data determines the story. A difference of two or three days' data will probably not affect how two stories compare.
Suggest that each student work with a partner to decide how the stories of the fall and winter graphs compare. After students describe to their partners how the stories are alike and different, invite them to share their ideas with the entire class.
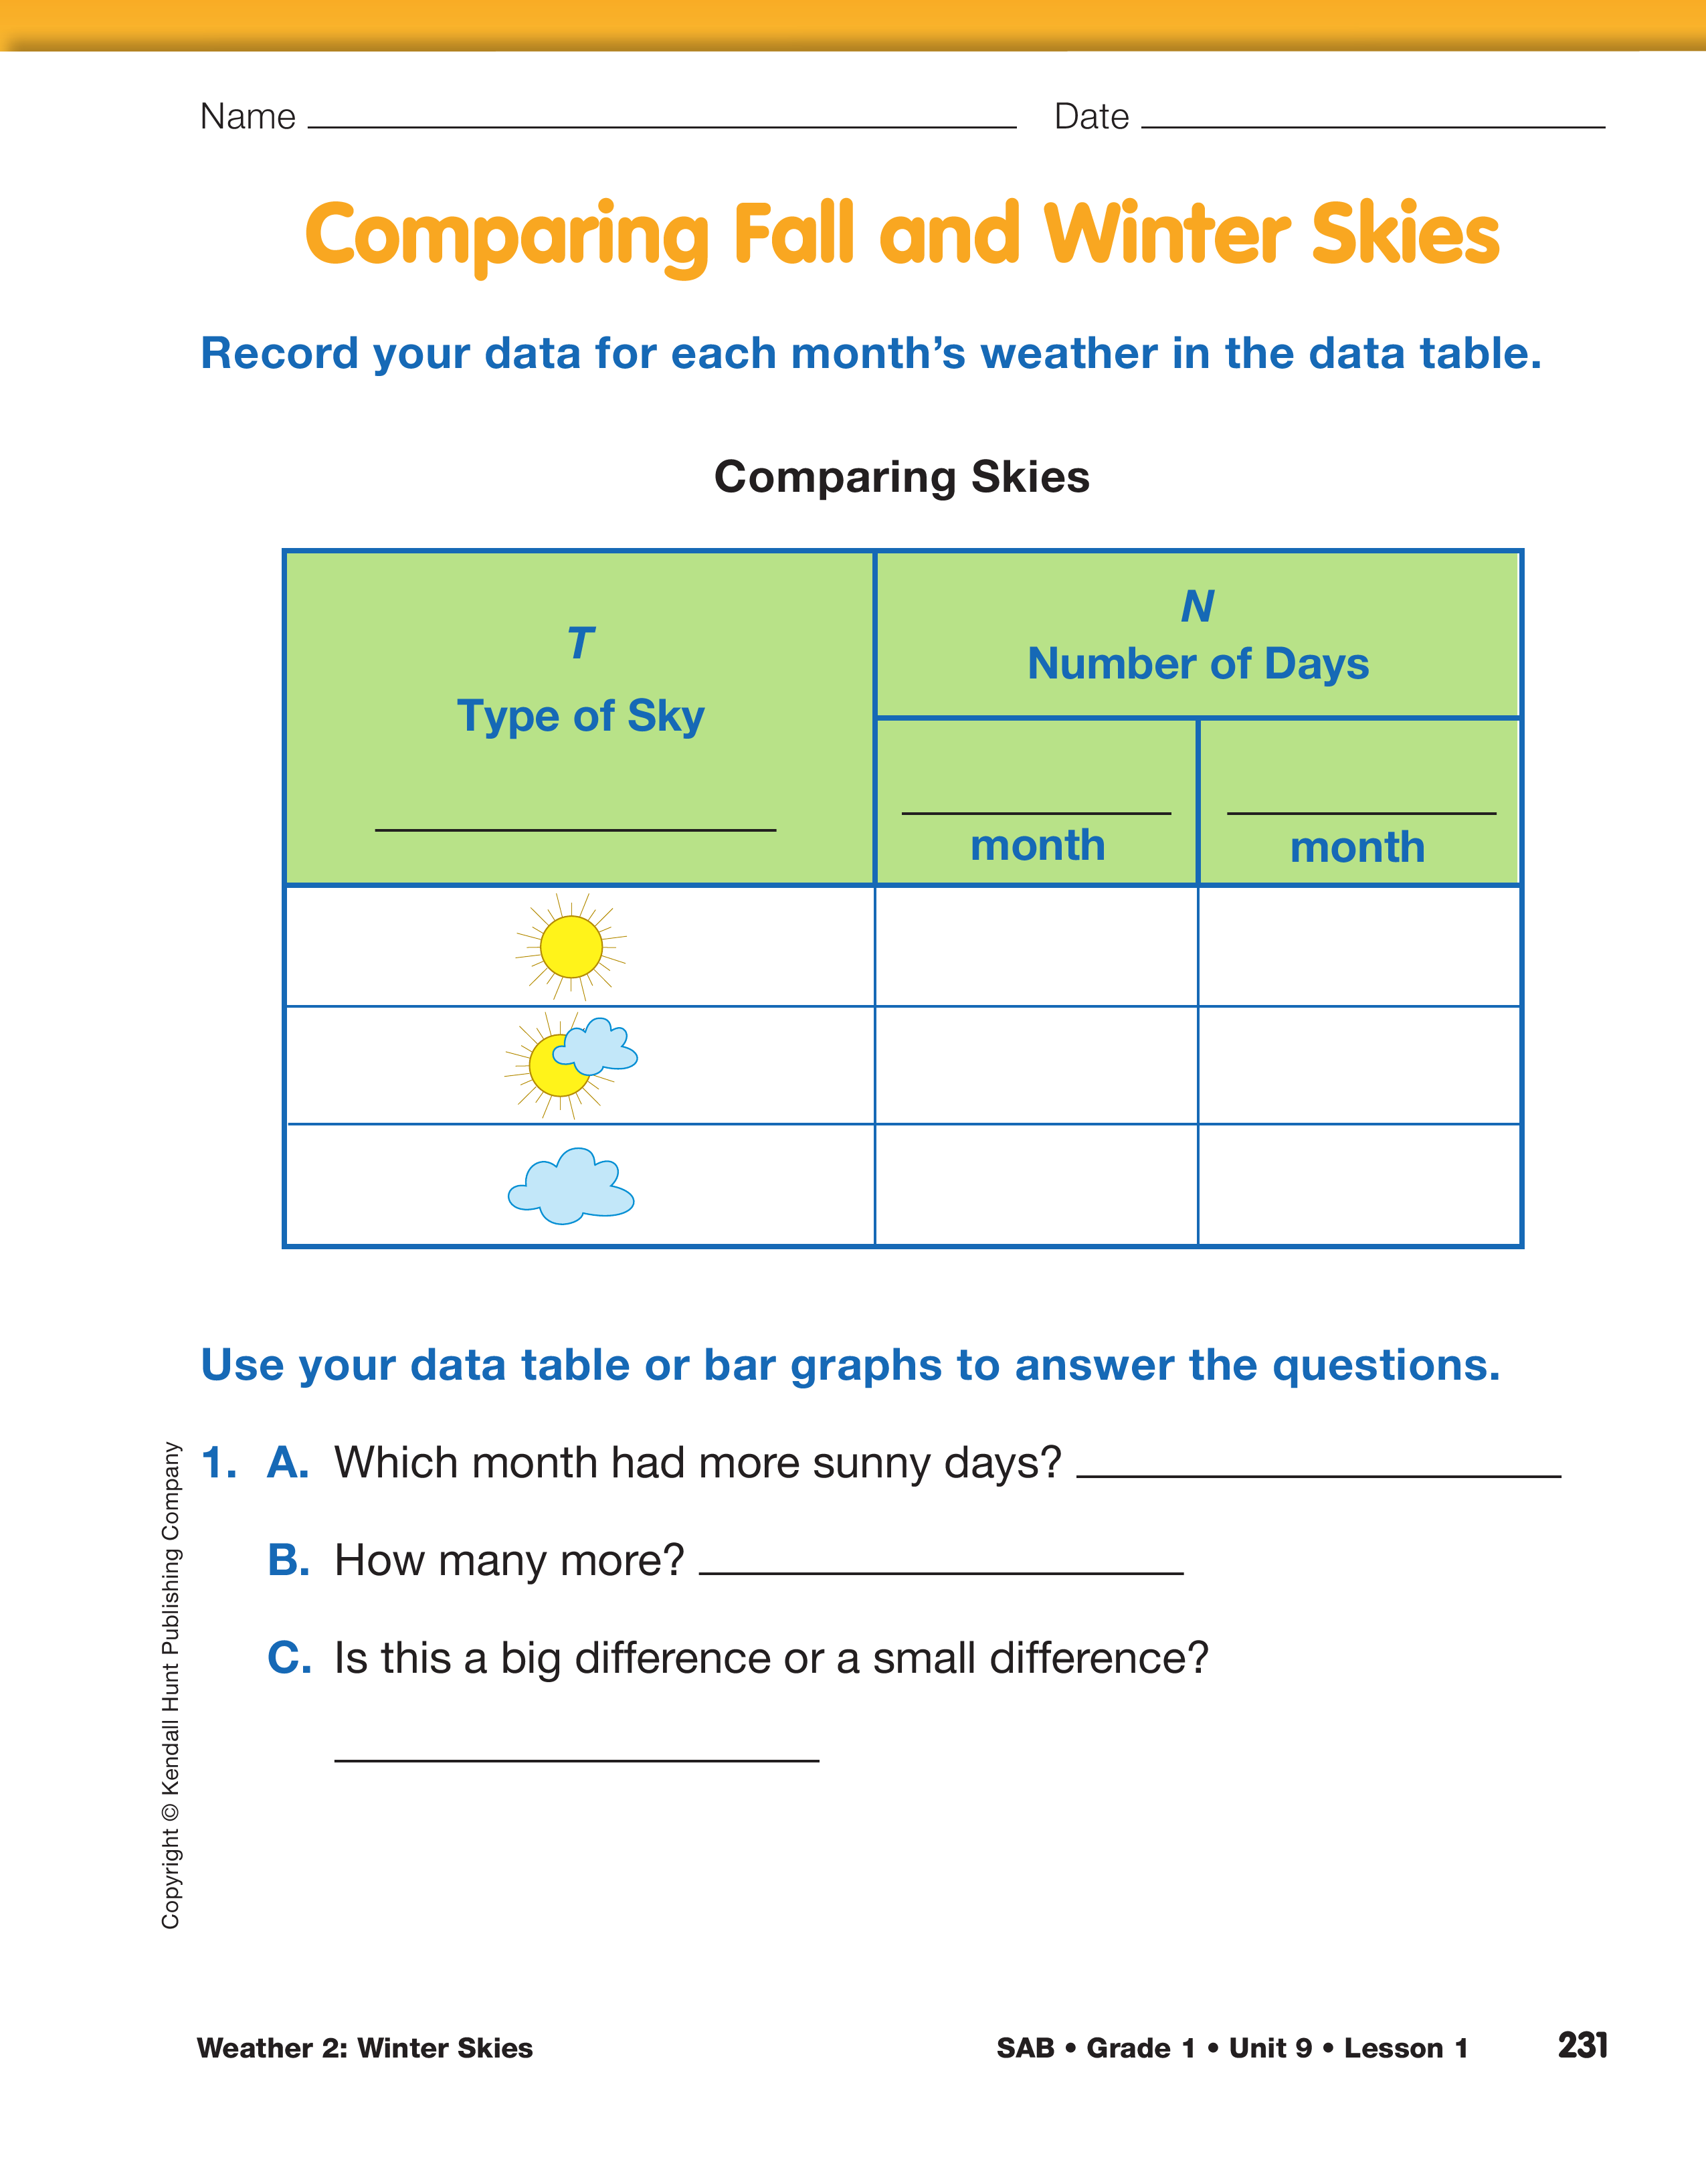
Bring the lab to a close by assigning the Comparing Fall and Winter Skies pages. Students will need to add the names of the two months they used to the data table.
To help students compare the two months, review the discussion the class had in Part 1 and refer to the predictions students made. Allow students to revise their initial answers based on their collected data. Students should be able to use data to support their answers.
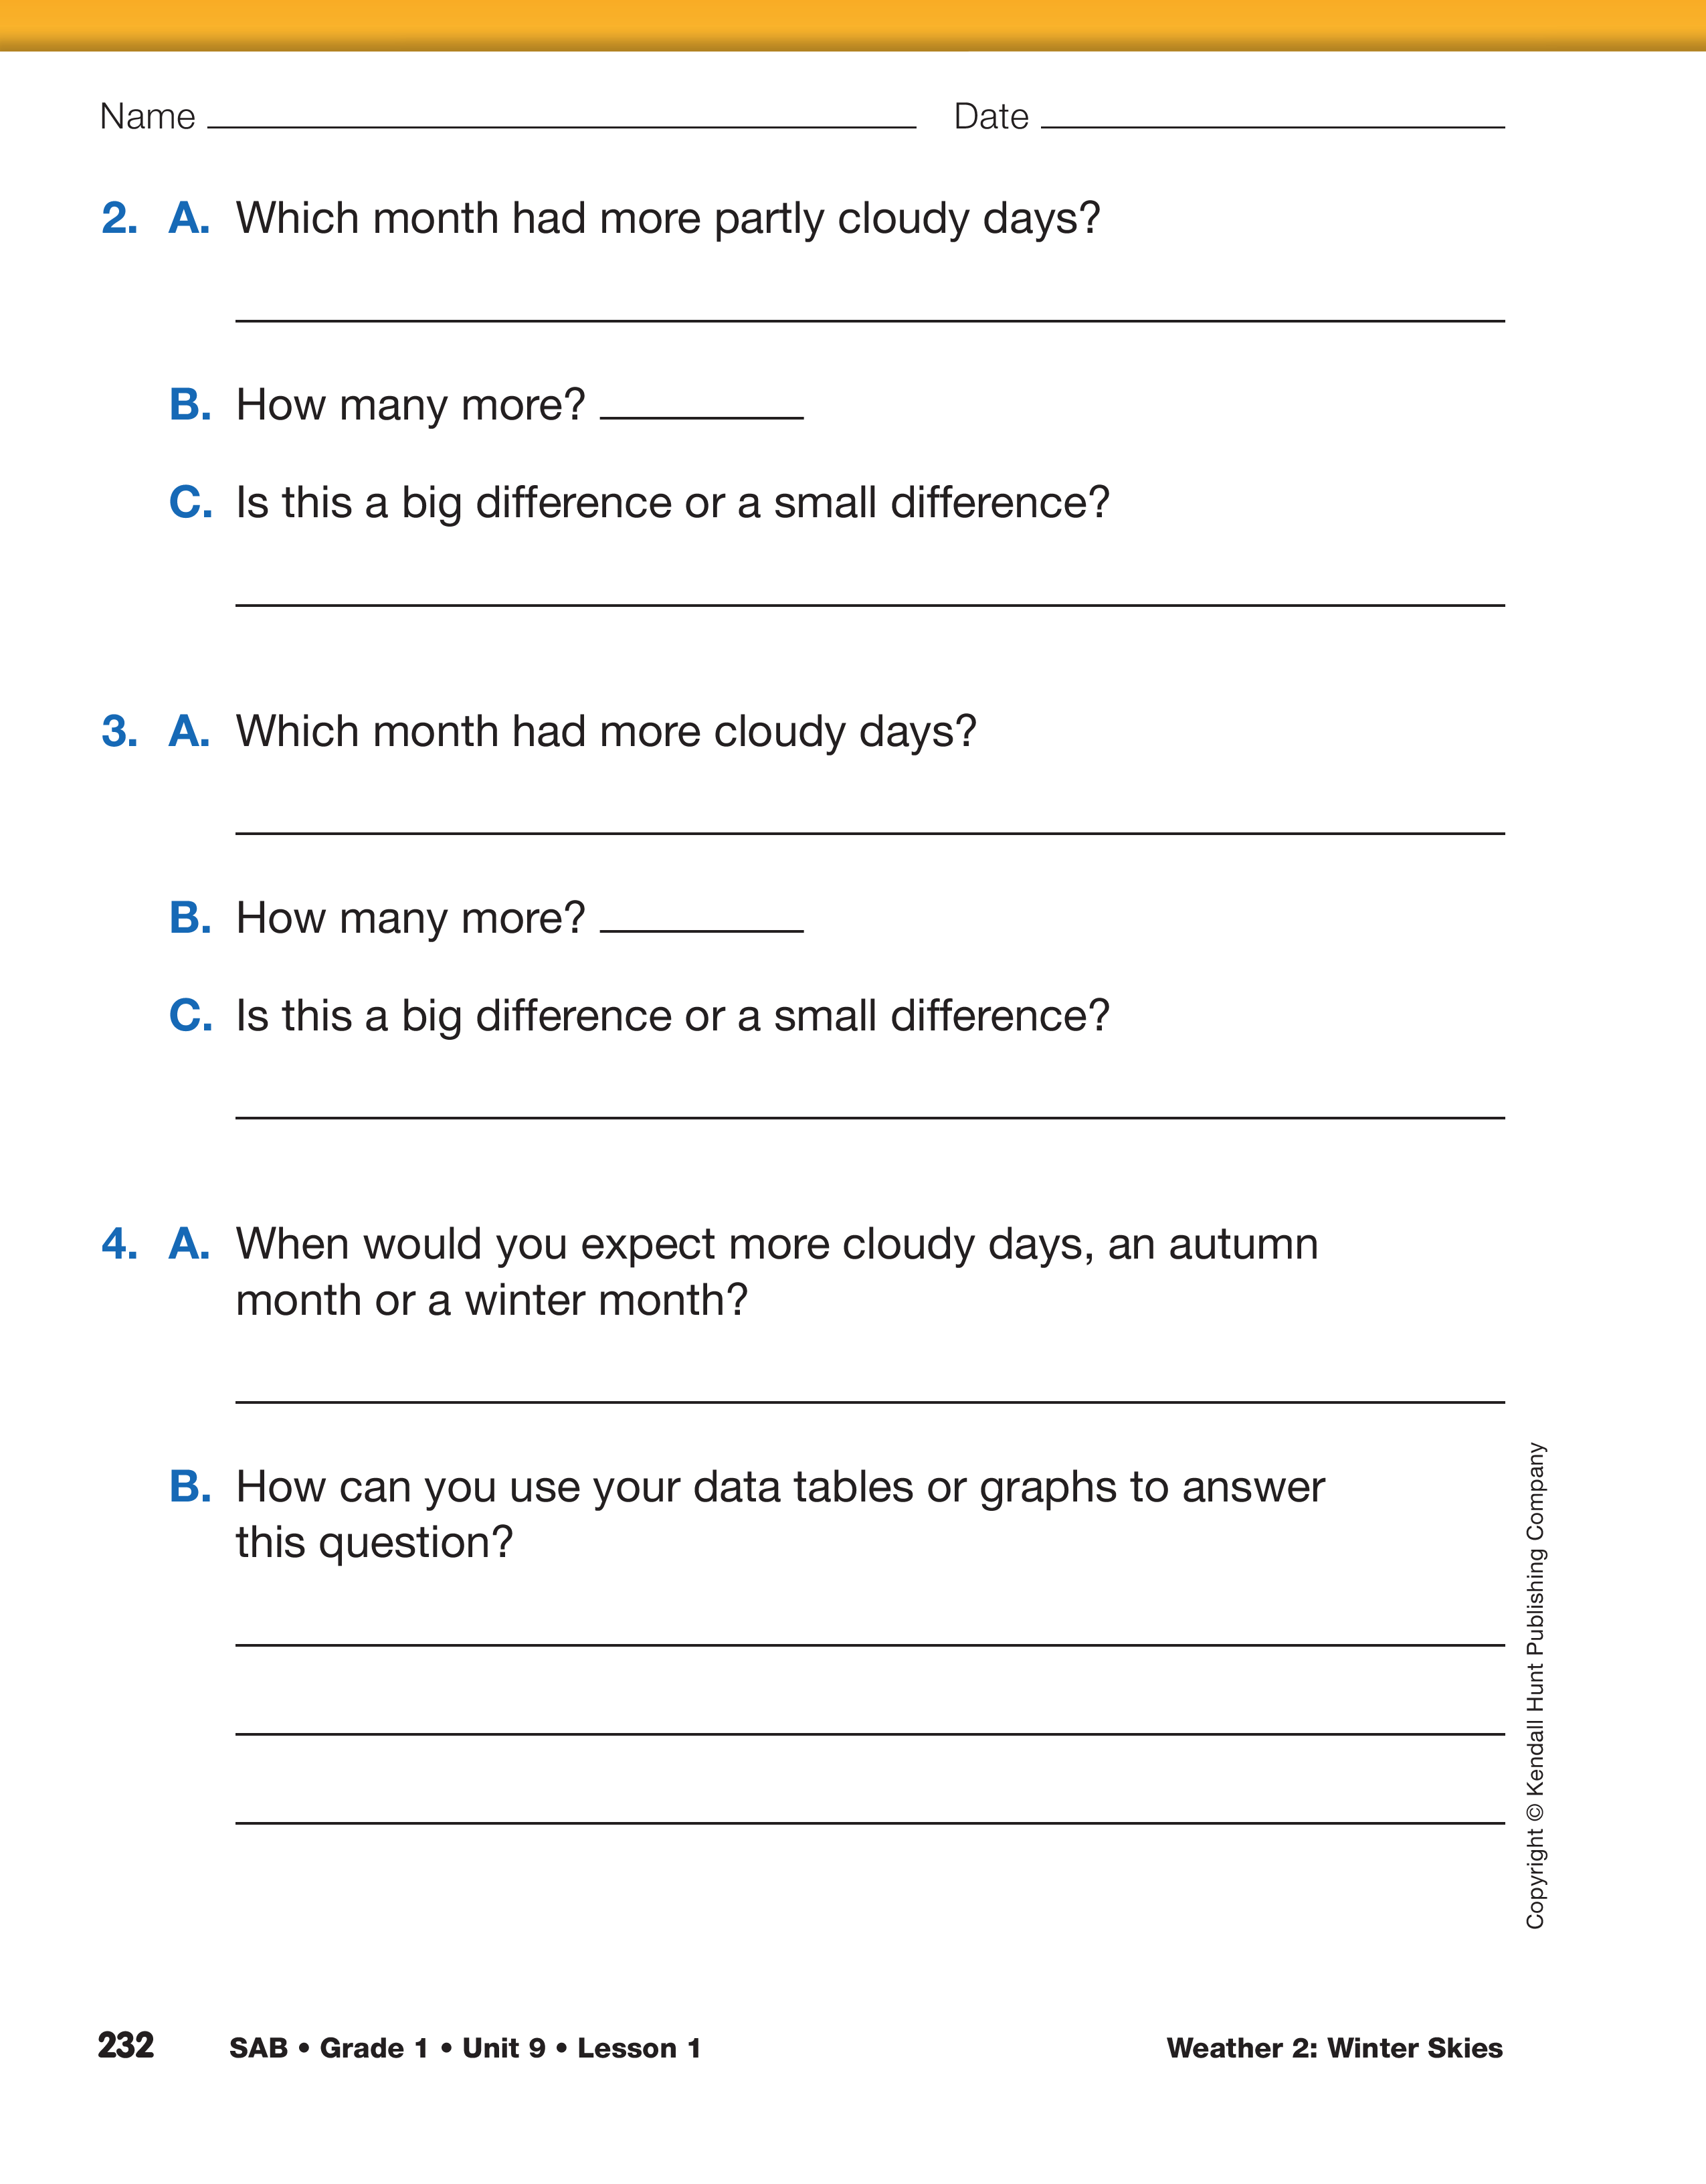
Ask the following questions again: