When students have demonstrated their ability to tell
the story of the graphs, present student pairs with the
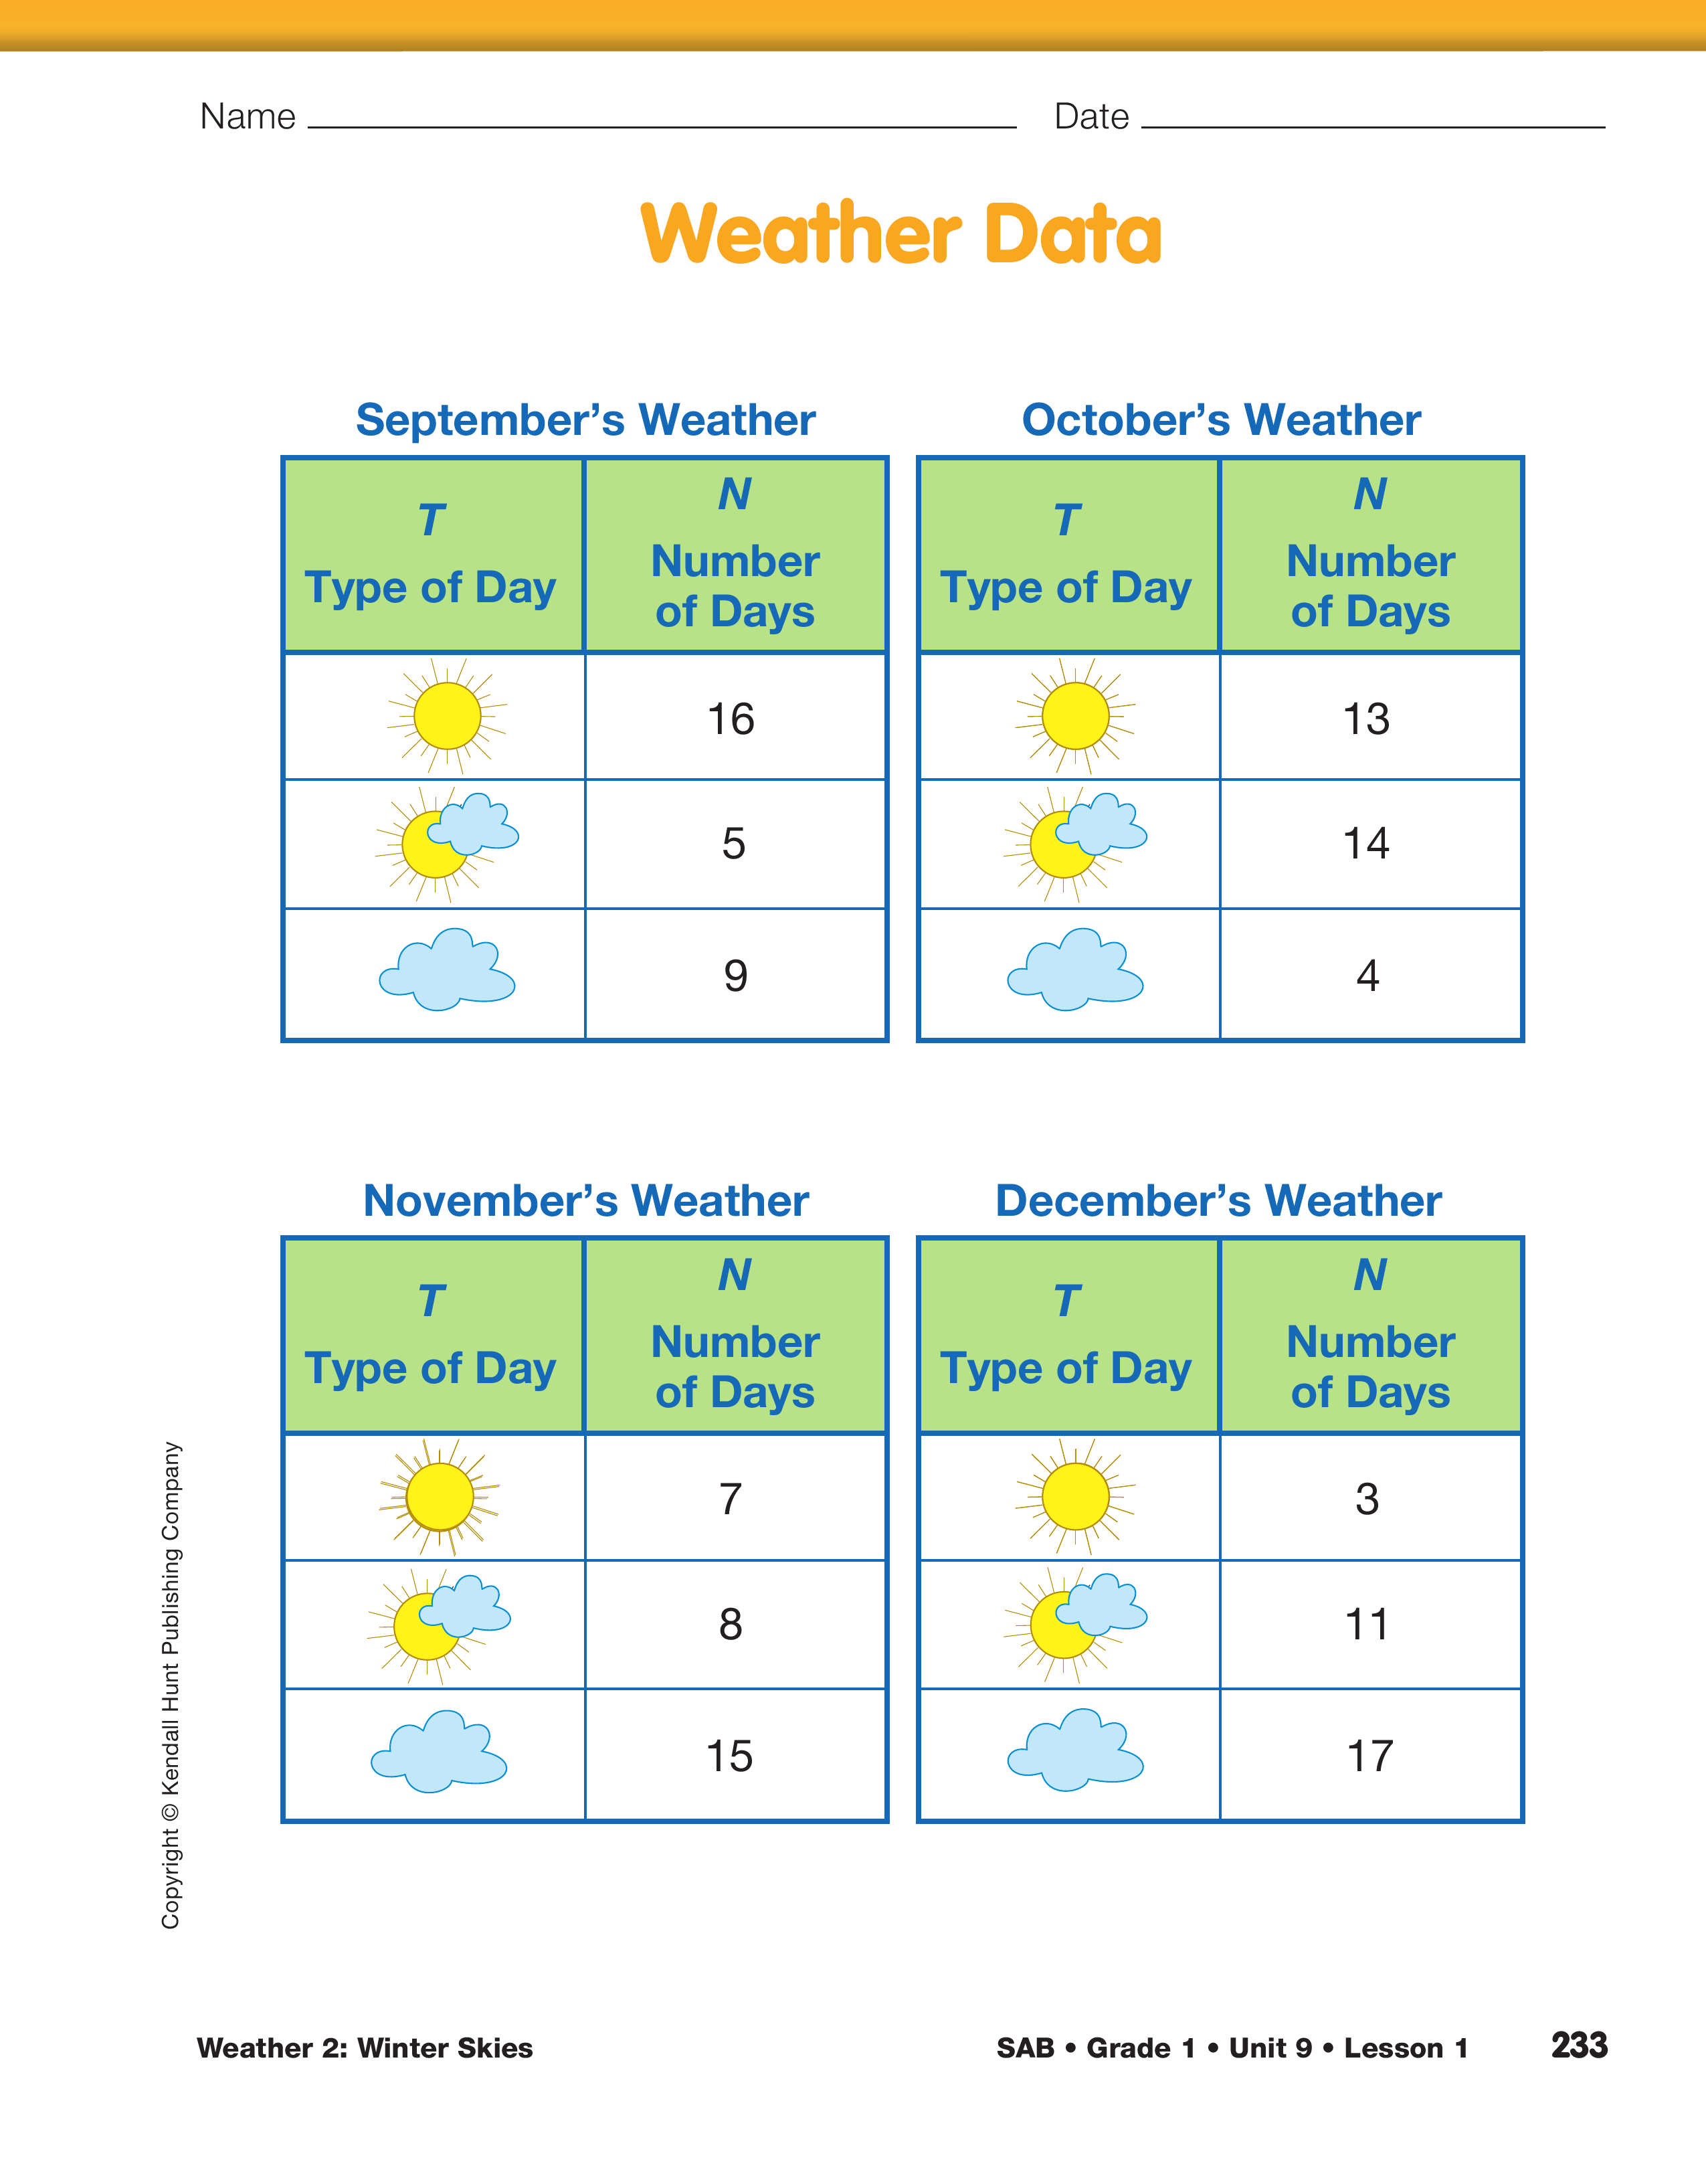
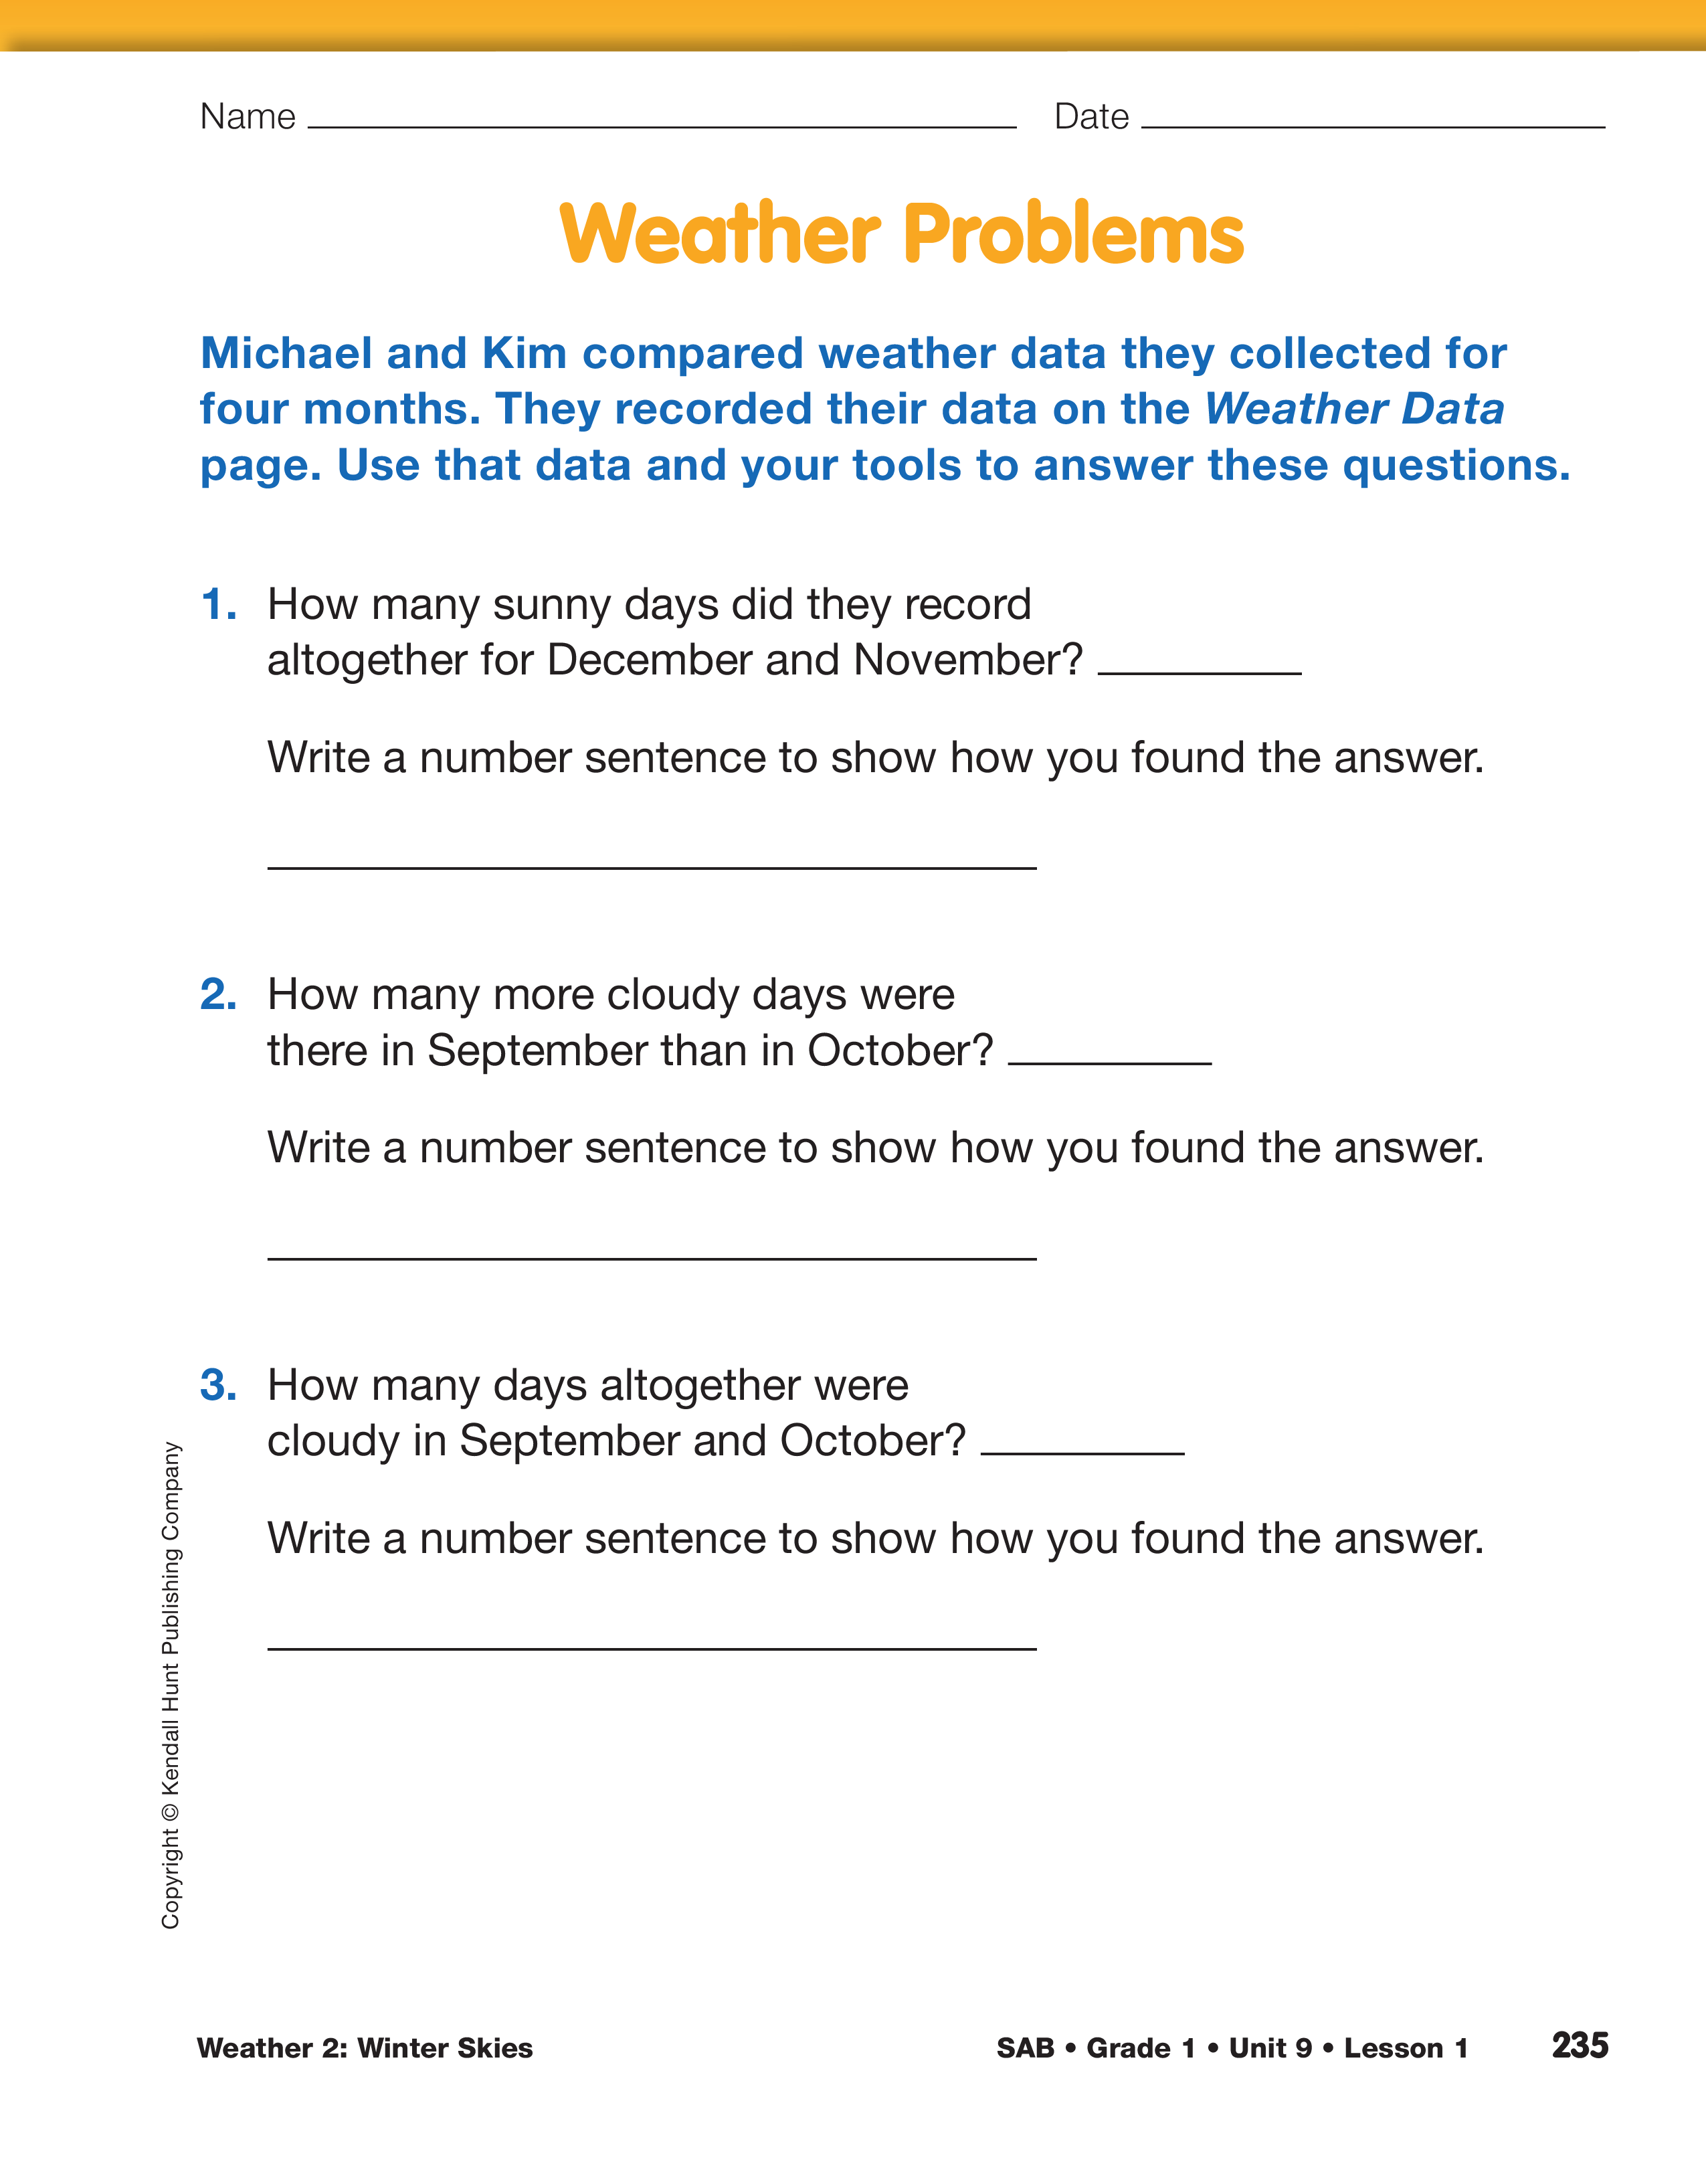
Weather Data page and the Weather Problems pages
in the Student Activity Book. On the Weather
Problems page students are prompted to use the
information from data tables on the Weather Data
page.
As you display both pages, spark students'
thinking by asking:
- How could you find the total number of partly
cloudy days in the four months? Talk with a
partner about the tools and strategies you could
use to solve this problem.
Help students by discussing the tools—tallies, connecting
cubes, calculators, counters, ten frames,
number line, and strategies such as counting on—that
they have available to help them solve the problems.
After students have worked on these questions independently,
allow time for them to share the thinking
they used to solve the problems. Explore several
ways to find the total of sunny days recorded on the
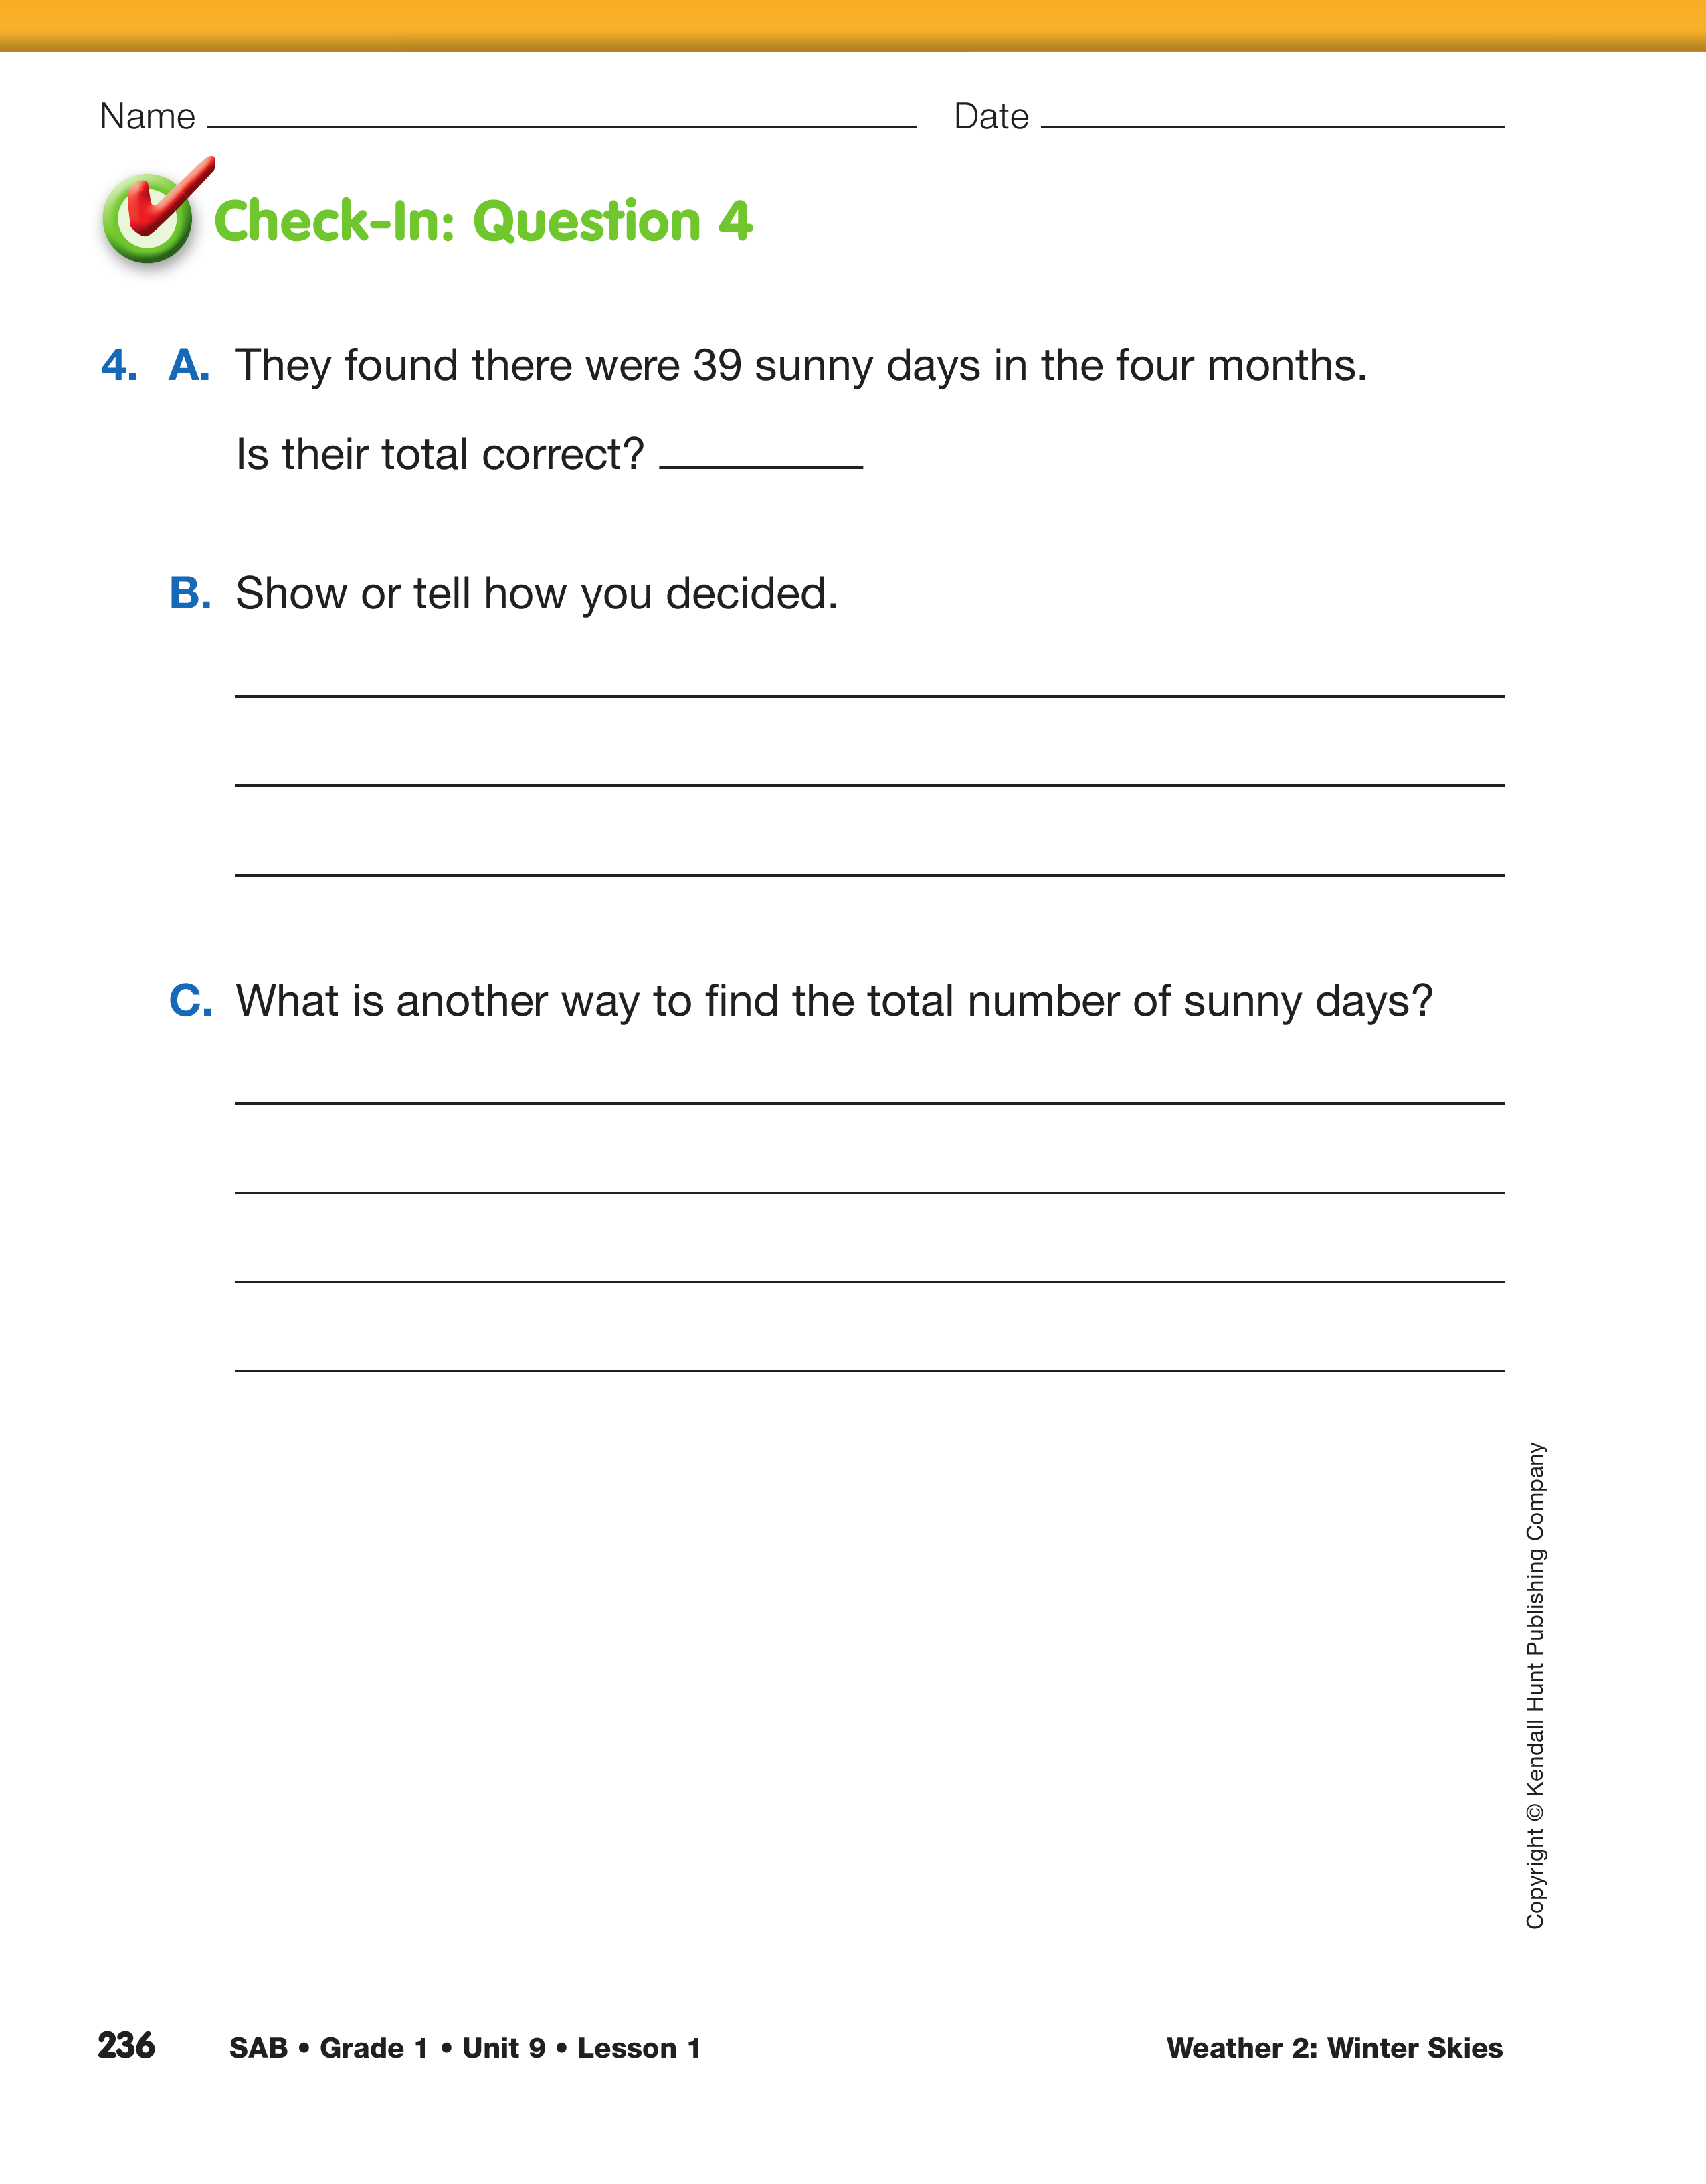
Weather Data page. See Check-In: Question 4 on
the Weather Problems pages.
- How did you find the total number of sunny days
in the four months?
- Show another way to solve this problem.
- Did anyone use a different tool to help them solve
the problem?
- How many more sunny days were in September
and October than were in November and
December? Show how you know.
- If you were a weather forecaster who had to predict
the weather, which graph, October's or
February's, would you use to predict next year's
October's skies? Why? (Possible response: I
would use October's graph because all Octobers
are pretty much the same.)
- Suppose you used your February graph to predict
next February's skies. Could you tell exactly how
many sunny days there would be? (Possible
response: No; even though I can tell exactly how
many sunny days there were this year, I wouldn't
be able to tell exactly how many sunny days
there will be next year. The best I can do is to tell
about how many there might be.)

Use Check-In: Question 4 on the Weather Problems pages in
the Student Activity Book to assess students' progress toward
reading data patterns in a data table [E10]; solving problems
about a data set represented in a data table [E11]; finding a
strategy [MPE2]; checking calculations [MPE4]; and showing
work [MPE5].


