Z. Ratios 


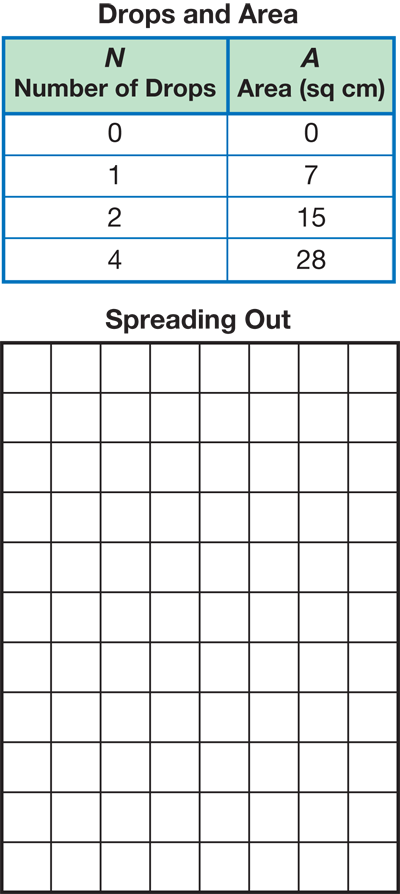
Manny put 1, 2, and 4 drops of liquid on three pieces of the same brand of paper towel. He counted the area of each spot formed. His data are shown in the table.
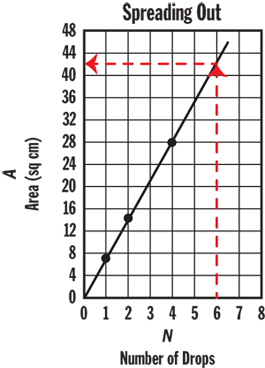
- Graph Manny's data. Graph the number of drops on the horizontal axis and the area on the vertical axis. If the points suggest a line, use a ruler to draw a best-fit line.
- If Manny put 6 drops of liquid on the paper towel, predict the approximate area of the new spot. Show or tell how you know.
- Write three equal ratios in fraction form for the ratio of the area to the number of drops. Show how you can use your graph to find the ratios.


