Lesson 2

Equivalent Fractions and Ratios

Est. Class Sessions: 3

Daily Practice and Problems

Teacher Notes
X

TIMS Task

  1. Answers will vary. Students may state that the points tend to go uphill or that Nila can do more and more sit-ups as she gets older.
  2. uphill
  3. Answers will vary. Nila can do more and more sit-ups as she gets older. She made no progress in the number of sit-ups she could do between the ages of 8 and 9.
  4. Yes
  5. Predictions will vary. About 39 or 40. Accept predictions between 37 and 42 sit-ups. See graph in Question D.
  6. Yes, I can find the age on the horizontal axis. Draw a dotted line to the best-fit line and then go across to the vertical axis to predict the number of sit-ups.

D. Using Best-Fit Lines

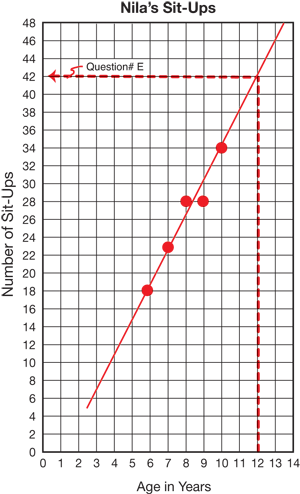
Each year, Mrs. Welch, a gym teacher at Bessie Coleman School, records the number of sit-ups each student can do. Nila used her data to make a graph which shows the number of sit-ups she could do each year.

  1. Describe the graph.
  2. If you read the graph from left to right, do the points go uphill or downhill?
  3. What does the graph tell you about the number of sit-ups Nila can do?
  4. Do the points lie close to a straight line? If so, use a ruler to draw a best-fit line.
  5. If possible, predict the number of sit-ups Nila will be able to do when she is 12.
  6. Does knowing Nila's age help you predict the number of sit-ups she can do?